Market Overview: NASDAQ 100 Emini Futures
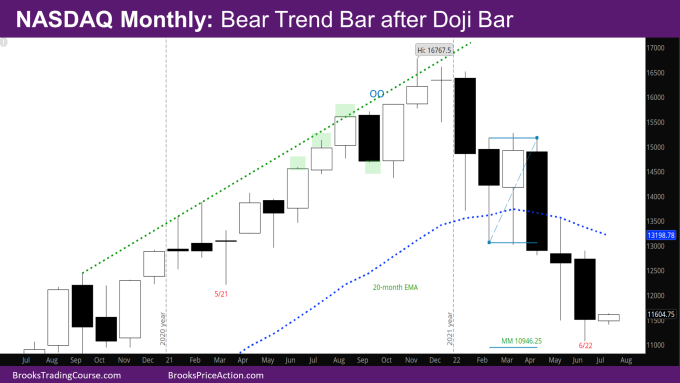
NASDAQ Emini futures June monthly bear trend bar with a small tail at the bottom. The bulls had a fairly big tail below on the monthly bar going into the last week of June. They also had a close above the midpoint. However, the bears sold early in the week and made sure the June month has a pretty good bear body. The one positive for the bulls is that the close is above the low of last month.
Since the May month is a doji bar with a big tail below it, the market is unlikely to break below it. So even with a good bear bar for the month of June, it’s more likely that July will disappoint the bears by being a bull bar or a doji bar. The market may test below the June bar to see if there are more buyers or sellers. Likely, sellers will wait to sell higher. The bulls will also buy to try and create a double bottom with May.
NASDAQ 100 Emini futures
The Monthly NASDAQ chart

- This month’s candlestick is a bear trend bar. It’s the 3rd consecutive bear bar closing below the exponential moving average (EMA), and a four-bar bear micro channel.
- The market is at the bottom of the bull channel that started in November 2020. This is another reason for the market to go sideways to up for the next several months.
- The next target for bulls is the top of the most recent sell climax – 12899.25.
- The bears would still like to make their target at the measured move (MM) down of the double bottom (DB) on monthly chart at 10946.25. This is right around the low of the November month mentioned above. This is still a viable target.
The Weekly NASDAQ chart

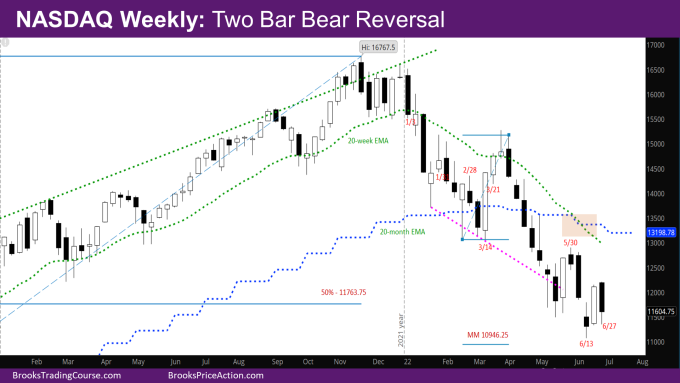
- This week’s NQ candlestick is a bear bar closing below its midpoint, with a small tail at the bottom.
- This week was pretty important in deciding the shape of the monthly bar, just like the last week of May being a big bull bar helped make May a doji bar. With the week being a fairly good bear bar, it helped make the June month a bear trend bar.
- This week’s body has a big overlap with last week’s bull bar, so acts like a two-bar reversal.
- The market has essentially been in a trading range for the last 8 weeks. What is not clear is where is the top and bottom of the range is. One reasonable assumption is that the top is somewhere near the 5/30 high/weekly EMA, and the bottom somewhere near the 6/13 low.
- As mentioned in last week’s report, the bull reversal last week is a minor reversal. There have been only 2 bull bars in the last 13 weeks. Bulls will need a 2nd entry buy after forming a good bull signal bar in the coming weeks.
Market analysis reports archive
You can access all weekend reports on the Market Analysis page.

