Market Overview: NASDAQ 100 Emini Futures
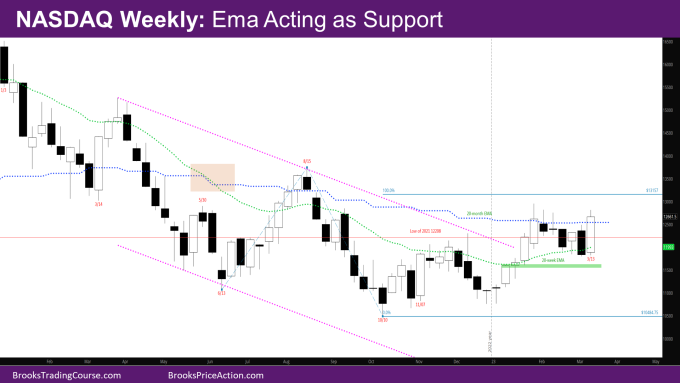
The NASDAQ Emini futures market had a big bull surprise bar closing above last week’s bear bar and above the monthly exponential moving average (EMA), with weekly EMA acting as support.
The market has completely reversed the big bear bar of last week and is back near the high of the range from the end of January. Now the question is – Will there be buyers here or sellers? Is it too high in the trading range from early February? The answer is that sellers will likely come in soon. The monthly report had mentioned the high of the February month as a target, since it was a bad signal bar. Odds are the market will go above the February high and then sellers should come in.
The monthly chart so far is a bull bar closing just above the monthly EMA, with most of the body below the monthly EMA. It is possible that in the next two weeks, the market tests the high of February and then closes with a tail above, to make March a bad bull bar.
NASDAQ 100 Emini futures
The Weekly NASDAQ chart

- This week’s NASDAQ candlestick is a big bull trend bar with a small tail above.
- The bar opened at the weekly EMA and closed just above the monthly EMA.
- As has been mentioned in the past reports, the market seems to be in a trading range between the monthly and weekly EMA.
- Based on the big bear bar last week, the likely result was the market at least testing below last week’s low
- Instead, the market reversed without going below last week’s low.
- It’s also possible bears were waiting to sell higher, and this is a vacuum move back up to the monthly EMA where both bulls and bears will sell again.
- One important thing for the bulls is that the weekly EMA has acted as support in the leg down since February -– the bears tried twice, and bulls bought the EMA both times.
- A second leg up was expected after the strong move up in January. This is likely the start of the 2nd leg.
- The question is how big is the 2nd leg (as in how many bars up)? And will it be strong enough to create a 3rd leg up?
- Bulls need a strong follow-though bar to convince that this is not the end of the 2nd leg up.
- As mentioned earlier, the problem with big bars is that it attracts profit takers.
- For example, bulls who bought the EMA again last week have big profits this week and would like to take it.
- What would have been better for the bulls is to have a smaller bull reversal bar at the weekly EMA.
- If bears can produce strong bear bar next week, it will convince traders that this is likely the end of the 2nd leg, and could lead to two legs sideways to down.
- If bears produce a bad sell signal bar next week, there will be buyers below.
- Some bull targets other than the high of February month that have been mentioned in prior reports are:
- Leg1/Leg2 target at 13157 where Leg 1 is the move up from June to August and Leg 2 is the move up from October.
- Close of Week of 8/8 at 13569.75 – the last bull bar of the micro channel up in August. That was a reasonable buy the close bar, and there are trapped bulls up there.
- Since bulls did not have a good signal bar in January or October, the reversal up since January is still likely a minor reversal, and bulls will need a good signal bar around the bar from the week of 1/2.
The Daily NASDAQ chart

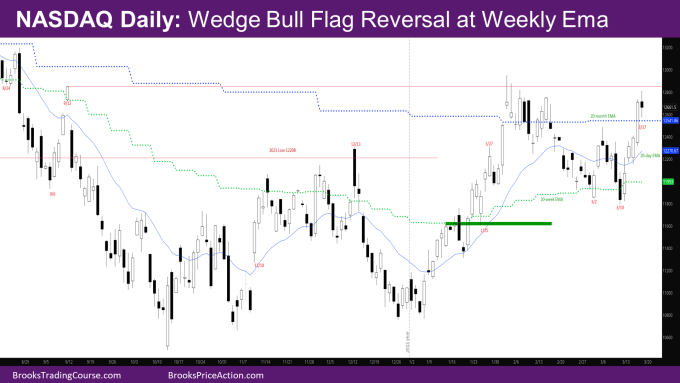
- Friday’s NQ candlestick is a doji bear bar with big tails above and below.
- It is a bad sell signal bar, so if the market goes below it first, it will likely find buyers.
- This week was impressive for the bulls. Every day other than Friday was bull trend bars with good bull bodies.
- The move down from February looks like a nested wedge bull flag or a wedge to 3/2 and a Double Bottom (DB) 3/10 – 3/2, and this week is a reversing back up.
- The one problem for the bulls again is that the signal bar for the reversal up this week is the big bear bar of 3/10. If one goes back and sees all the reversals in the past year that started with bad bear bars, they have been minor, and those bars have been retested.
- This has also been mentioned in the weekly section.
Market analysis reports archive
You can access all weekend reports on the Market Analysis page.

