Market Overview: NASDAQ 100 Emini Futures
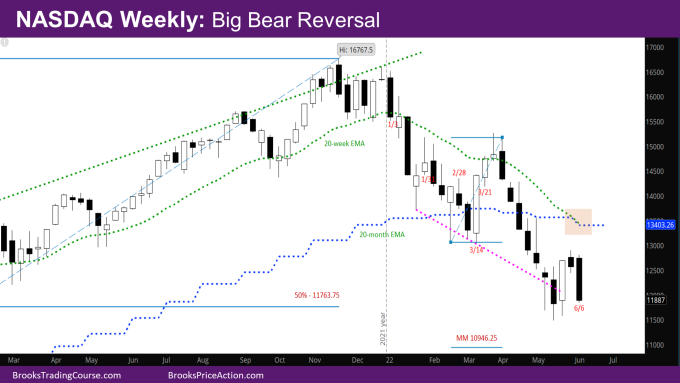
The NASDAQ Emini futures weekly candlestick is a big weekly bear reversal bar closing on its low. This week completely reversed the bull bar from two weeks ago.
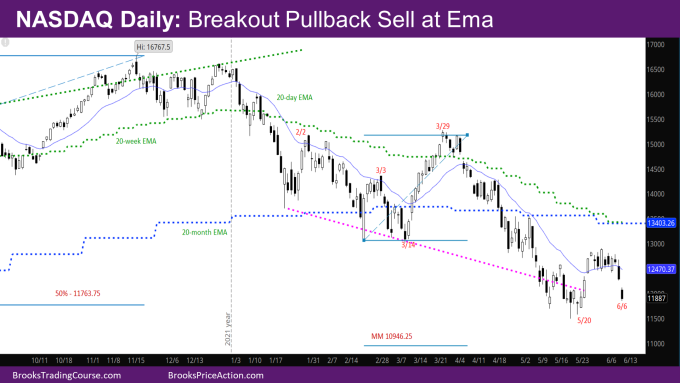
The week started by continuing the tight trading range from last week. Wednesday was a Low 2 sell signal bar, which triggered the bear breakout on Thursday and Friday.
Last week’s report had mentioned that it was more likely for the market to test the high of the May month first, but based on this week’s action, the market is testing the low first.
NASDAQ 100 Emini futures
The Weekly NASDAQ chart

- This week’s bar is a big bear reversal bar closing on its low, essentially reversing the big bull bar from two weeks ago.
- The reversal this week keeps the gap open with the low of March. There has only been one bull week in the last 10 weeks. These are strong indicators that the downside targets mentioned below will be met.
- The next target for the bears would be the measured move (MM) down of the double bottom (DB) on monthly chart at 10946.25, or the open of the November 2020 month at 11139.5. November 2020 is when the spike on monthly chart started after the sideways months of September and October.
- Since the market is not testing the May high, the bull upside targets mentioned in last week’s report are less likely (~20%) for the month of June –
- Monthly exponential moving average (EMA) at 13467
- High of the May month at 13555.25 (essentially at the monthly EMA)
- The Weekly EMA is touching the monthly EMA and will cross below the monthly EMA. The last time the weekly EMA crossed below the monthly EMA was during the 2008 financial crisis.
The Daily NASDAQ chart

- Friday’s NQ candlestick is a bear bar closing near its low. It is a follow-through bar to the bear breakout on Thursday
- The market broke the trendline and went above the daily EMA couple of weeks ago. It then was in a trading range for the past two weeks.
- As is expected for the 1st time going above the EMA this week after more than 20 bars, sellers got a great Low 2 sell signal bar on Wednesday pushing the market down.
- Also as was mentioned in the daily chart report two weeks ago, the reversal bars for the bulls have been bear bars (5/24), which usually leads to a minor reversal and the market testing them back.
- At this point, the question is – will this leg down lead to a lower low or a higher low? Based on the strength of the bears on the weekly chart, it is more likely for the market to make a lower low to the targets mentioned rather than a higher low.
Market analysis reports archive
You can access all weekend reports on the Market Analysis page.

