Market Overview: NASDAQ 100 Emini Futures
The NASDAQ Emini futures market had a bear breakout from the sideways bars of the past two weeks to begin the Nasdaq 100 pullback of the bull micro channel of the past 6 weeks.
The month is now a Low 2 bear doji reversal bar at the monthly exponential moving average (EMA). There are two more days in the month – Bears will try to sell so the signal bar has a good body. Bulls will want to buy so the sell signal has a tail below.
One problem for the bears on the monthly chart is that the bear reversal bar will be trying to reverse a bull micro channel (low of bar higher than prior bar for past several bars), although mostly sideways bars. So even if the sell signal should trigger on the monthly chart, it will likely reverse within a month or two, as there should be buyers below.
NASDAQ 100 Emini futures
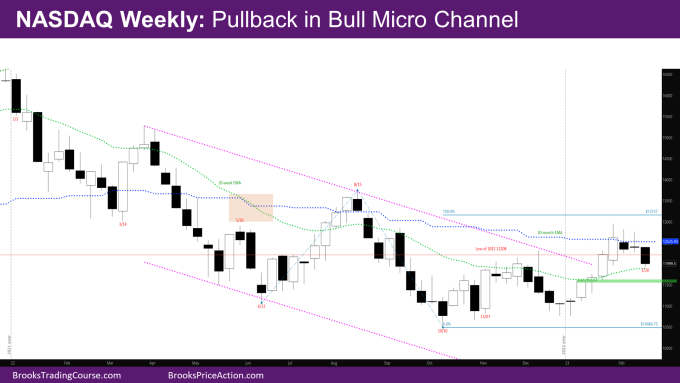
The Weekly NASDAQ chart

- This week’s candlestick is a bear breakout bar breaking out of the inside-inside bar of the last two weeks with a close just above the weekly EMA.
- As mentioned last week, an inside-inside bar is a breakout mode situation – i.e., it’s better to wait for a strong breakout to determine whether the market breaks up or down.
- The bear bar this week indicates the Nasdaq 100 pullback has started.
- The leg up is strong enough that there should be another leg up after the pullback.
- If bears produce weak bear bars in the pullback, bulls will buy for another leg up.
- If bears can produce a pair of strong bear bars closing on their lows, bears will sell assuming the monthly EMA is working as resistance.
- Given the strong bar this week, bears need a strong follow-through bar next week to convince sellers that there will be more down.
- Either way, there will at least be a small second leg down even if the market bounces next week. There are trapped bulls at the low of the inside-inside bars that were not expecting such a big bear breakout.
- The question is – Will the weekly EMA act as support? Given the market is so close to the weekly EMA, it will definitely test it and see if buyers come in.
- The market should find temporary support at the high of 1/9 around 11600. It was a credible sell at the weekly EMA for a possible 2nd leg down back, so a test target.
- Since bulls did not have a good signal bar in January or October, the reversal up in January is still likely a minor reversal, and bulls will need a good signal bar around the bar from the week of 1/2.
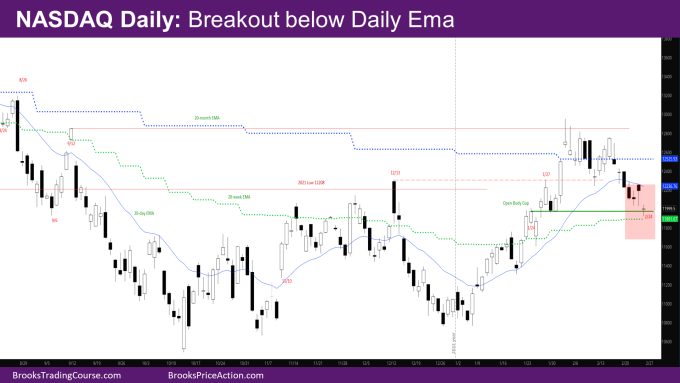
The Daily NASDAQ chart

- Friday’s NQ candlestick is a doji bar just above the weekly EMA.
- This week started with two good bear days to break below the daily EMA. Wednesday was a pause day.
- The two strong days meant a 2nd leg down was likely. Thursday traded above Wednesday but also traded lower. Friday gapped down and ended as a doji.
- The market is back at around 1/24 when the market broke above the weekly EMA.
- When the market gapped up on 1/26, the body gap with 1/24 was never closed since then (i.e., the market never traded below on any subsequent days to have body overlap with the body of 1/24).
- So, the question is – Will the body gap close? And will the market find support at the weekly EMA?
- It looks like the market has been in a bear leg of a trading range for the past 3 weeks. The leg down since January is a lot weaker than the leg down in December.
- In trading ranges, gaps close. So, it’s likely the body gap will close and the market will go below the weekly EMA to see where buyers come in.
- As mentioned before, the market is likely to be in a trading range between the monthly and weekly EMA till they get close enough.
Market analysis reports archive
You can access all weekend reports on the Market Analysis page.

