Market Overview: NASDAQ 100 Emini Futures
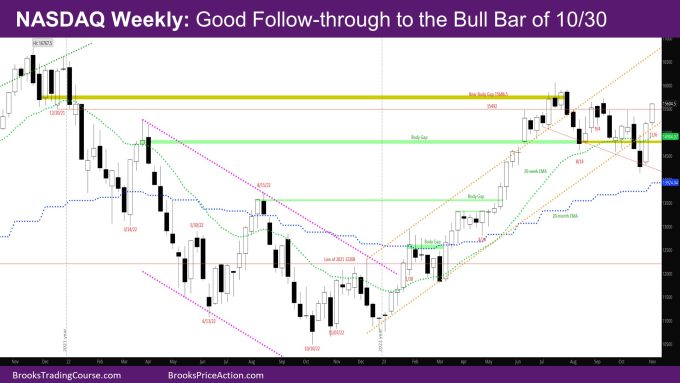
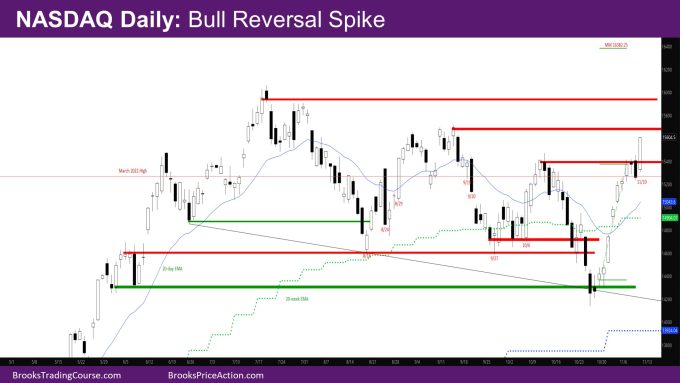
The NASDAQ Emini futures week is a good follow-through to the bull bar of 10/30. On the daily chart, this week closed above the first lower high of 10/12.
The monthly bar is a strong bull trend bar already above the October high. The problem for the bulls is that the bar is already close to the average range of the monthly bar of the past few months, and there are still 3 weeks left in the month.
NASDAQ 100 Emini futures
The Weekly NASDAQ chart

- The week is trend bull bar closing on its high with a small tail below.
- It is a good follow-through bar to the bull bar of last week, which was a reversal above the bear bar of the previous week.
- Bears needed to prevent such a good follow-through.
- The market is back near the resistance of the week of 9/11.
- The question now is – will the trading range continue or will bulls be able to breakout above the July highs and try for the next higher targets – high close of 2021?
- Bulls need another good follow-through bar next week.
- Bears would like to avoid a 3rd consecutive bull bar and instead want a bear bar or a bad looking bull bar and then follow-through bear bars.
- Since there are still 3 more weeks in the month, it’s likely that at least 2 of those weeks will be sideways to down.
- The market may do something similar to what happened at the end of March – mid April 2023.
- It’s not clear whether the next 2 weeks are sideways to down and bulls make a push at the end of the month, or will the bulls get another bull bar next week and then get 2 weeks sideways to down.
The Daily NASDAQ chart

- The report from a couple of weeks ago said that if the market did not reverse up from the support shown on the chart, that the next support would be the monthly exponential moving average (EMA).
- Well, the market reversed back strongly last week from the breakout below the trading range from June.
- Last week was a spike – every day was a bull bar with gaps and no pullback. This week there was only a 1 bar pullback on Thursday.
- The Measured Move (MM) target of the bull bodies of the spike would put a target for the bulls at 16382.25 which would put the market above the high close of 2021.
- This week the market closed above the first lower high of 10/12 with a strong bull bar on Friday.
- Now the bulls need a good follow-through bar Monday to show bulls that it has indeed gone above the first lower high with 2 consecutive bull close.
- The market is close to the next levels of lower highs from September and July as shown on the chart with red lines.
Market analysis reports archive
You can access all weekend reports on the Market Analysis page.

