Market Overview: NASDAQ 100 Emini Futures
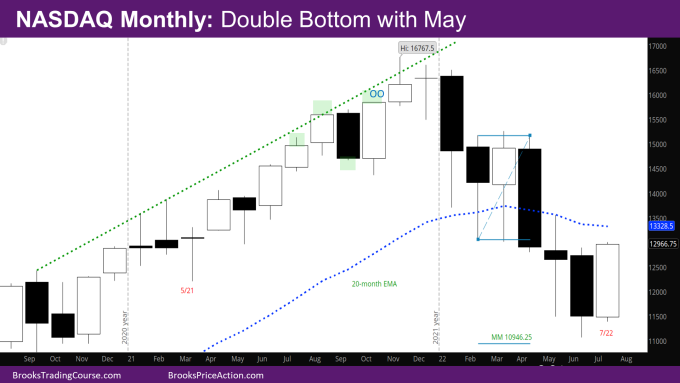
NASDAQ Emini futures July monthly candlestick is a big bull trend 2-bar reversal reversing June’s bear bar. The month closed above last month’s high, also the most recent sell climax. A NASDAQ 100 double bottom with May.
Last month’s report had made a case for July month to be a bull or doji bar. The bulls delivered a very strong month.
NASDAQ 100 Emini futures
The Monthly NASDAQ chart

- This month’s Nasdaq 100 candlestick is a big bull 2-bar reversal reversing June’s bear bar.
- Since the market was at the bottom of the bull channel that started in November 2020, it was likely for the market to go sideways to up for the next several months.
- The question now is whether there will be a tight trading range on the monthly chart, like we had on the weekly chart during June and July or will we see higher prices?
- The case for higher prices –
- There is a double bottom now with the May monthly bar.
- The case for sideways/tight trading range –
- The bars are big – In a trading range, big bars attract sellers at the top and buyers at the bottom.
- The signal bar – the month of June is a bear bar, so bulls will likely need a second entry with a good bull signal bar.
- Likely, bulls have done enough to go at least a little higher. Next target for bulls:
- monthly exponential moving average (EMA) around 13328.5
- High of May at 13555.25
- The bears would still like to make their target at the measured move (MM) down of the February-March double bottom (DB) on monthly chart with target at 10946.25. This is right around the low of the November 2020.
- The market came to within 70 points of this target in June. This is still a viable target unless the bulls create consecutive bull trend bars for the next 2-3 months.
The Weekly NASDAQ chart

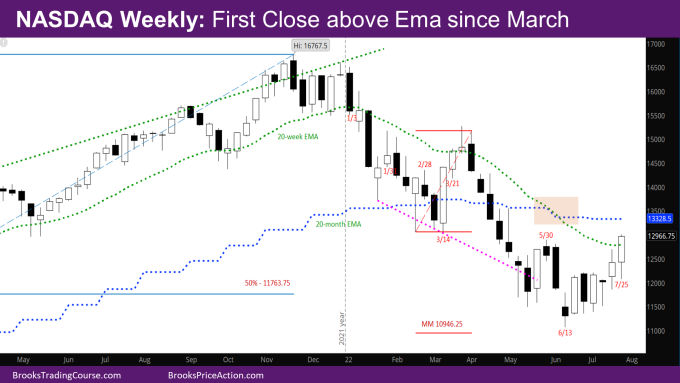
- This week’s NQ candlestick is a bull bar closing near its high, above the weekly EMA, and with a tail at the bottom.
- This week accomplished a lot for the bulls-
- This week was important in deciding the shape of the monthly bar, just like the last week of June being a bear bar helped make June a bear bar.
- first bull close above the EMA since the week of 3/28.
- closed above the last swing high of 5/30. The market is within 10 points of closing the gap with the March low.
- first consecutive bull close since March.
- Next week is very important to determine whether the trading range will continue, or whether we possibly have a breakout of the trading range.
- The bulls need a follow-through bull bar with the low near this week’s high/EMA and a close high above the EMA.
- The bar needs to look like the bar of 4/13/2020 (not shown in the chart) which had a open at the EMA and close far above it, with very little tails. If the bar can also close high above the monthly EMA, that would make even a stronger case.
- Bears will try to sell to create a double top with high of 5/30. Likely there will be something wrong with the bar next week for the bulls. It may cross the monthly EMA, but may end as a doji week, or a big tail at the top.
- The market is in a 6-week micro channel which means there should be a second leg up.
- As mentioned in previous reports, one of the problems for the bulls is that the signal bar from 6/13 is a bear bar, which usually means this is a minor reversal, and the market should come back to at least test that signal bar. The bulls could then create a good bull signal bar, for a double-bottom with the June low that could lead to a major reversal.
Market analysis reports archive
You can access all weekend reports on the Market Analysis page.

