Market Overview: NASDAQ 100 Emini Futures
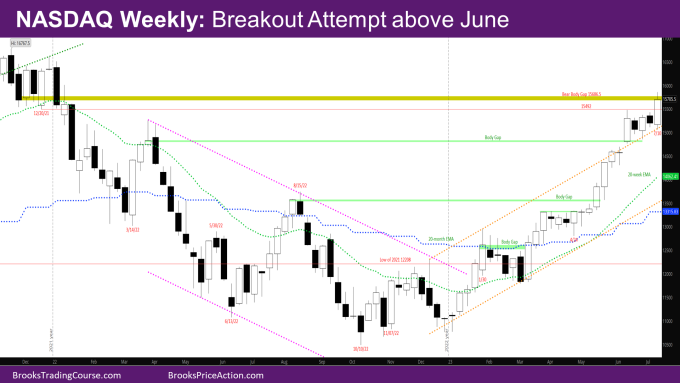
The NASDAQ Emini futures week is a big outside up bull bar with tails at the top and bottom. The market is making a breakout attempt above June.
The market continues to have closes above prior bar. This week triggered the bear reversal bar of last week and closed up as a bull bar.
NASDAQ 100 Emini futures
The Weekly NASDAQ chart

- The week is a big outside up bull bar with small tails above and below.
- Last week was the second bear reversal bar in as many weeks.
- Bears needed this week to close below last week, but they failed.
- The first target for the bears to is to close below the prior bar.
- If bears can do that, their next target for bears would be to close the body gap with the March 2022 close.
- The bulls met the targets mentioned in last week’s report –
- the low of week of 12/20/21 at 15492 because it was a big bull bar and a reasonable buy.
- the bear body gap of the week of 11/29/2021 at 15686.5. This gap was created when the week of 1/3/2022 and 1/10/2022 had a close below the 11/29/2021 close and there has been no bull bar overlapping with the body of 11/29/2021.
- This week’s body has a small overlap with the bear body gap mentioned above.
- Bulls need a bull follow-through bar to the outside bar this week.
- The next target for the bulls is –
- The high close of 2021 – 16338.75
- The all-time high in November 2021 at 16767.5
The Daily NASDAQ chart

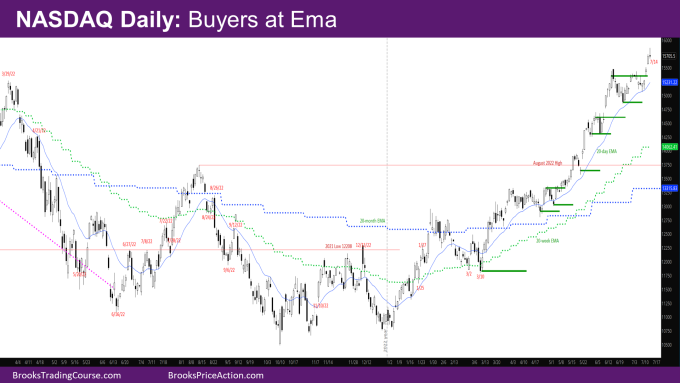
- Friday is a bad bear reversal doji with a long tail above and a small tail below.
- This week had bull bars every day.
- The market finally broke above the sideways move around the high close from 6/15.
- This is the most recent green shaded section in the chart above. This was shown in red last week to indicate that it was temporary resistance, and now has turned into temporary support.
- The market had been going sideways since 6/15 around that high close, likely waiting for the exponential moving average (EMA) to catch up.
- Monday this week sold off to the EMA and reversed as a buy reversal bar.
- This was the first time since early May when the market touched the EMA, so it was likely to find buyers, and did.
- Tuesday sold off and had some overlap with Monday but closed higher than Monday, providing a good entry bar.
- Wednesday gapped up much higher than Tuesday close and went above the June high and ended up as a trading range bar with tails above and below.
- Thursday gapped up again and ended up as a strong bull breakout bar above the June High.
- If Friday ended up as a bull bar, it would have acted as a follow-through to the breakout bar Thursday.
- Instead, Friday ended up as a bad sell signal bar with a big tail above and small tail below.
- Friday is not a strong enough sell signal for bears to sell yet. The market may have to test the breakout point above the June high. Depending on how strong that test is, bears may sell higher for a 2nd leg down.
Market analysis reports archive
You can access all weekend reports on the Market Analysis page.

