Market Overview: NASDAQ 100 Emini Futures
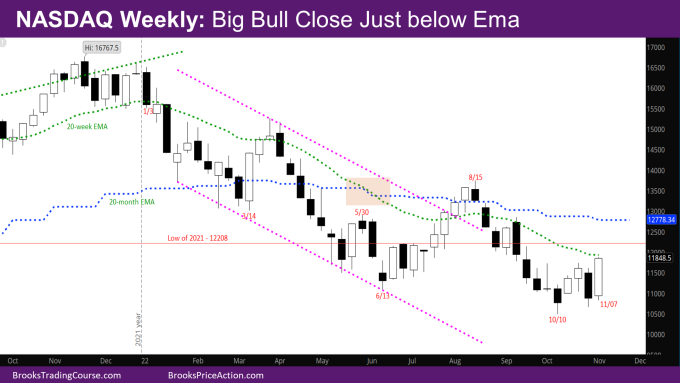
NASDAQ Emini futures market reversed up strongly from last week and is a Nasdaq 100 big bull close just below weekly exponential moving average (EMA).
Last few weeks have made the case for the market to go sideways to the weekly EMA. Now that the market is almost there, the next question is – does the market reverse around the weekly EMA or does it break above?
NASDAQ 100 Emini futures
The Weekly NASDAQ chart

- This week’s candlestick is a big bull bar closing just below the weekly EMA.
- As mentioned before, big bars closing just near the EMA usually attract sellers. So, the bears will sell the EMA or the close of next week if it’s a bull bar.
- At this point, bears have tried selling twice and the market has reversed – They sold the week of 10/24 that created the tail below, and they sold last week – 10/31, and this week reversed it.
- If next week is a bear bar with a big tail below (like the week of 7/11), it will likely signify higher prices.
- If next week is a good bear bar, it will be a Low 2 sell signal bar at the EMA, and likely there will be sellers below.
- If the market can gap up above the EMA on Monday, and next week is a good bull bar, bulls have an opportunity to create a big bull bar closing far above the EMA (like the bull bar the week of 4/13/2020).
- At that point, there will be a pair of strong bull bars, but the market will be near the next resistance – monthly EMA.
- One problem for the bulls again is that the signal bar from the week of 10/10 is a bear bar like back in June.
- This is still likely a minor reversal and bulls will need a good entry bar in the next month or two around the bar from the week of 10/10.
- As mentioned in last week’s report, the low of last year at 12208 will be a magnet for the rest of the year. The bulls want to close the year above the low of last year, while the bears want a close far below the low.
- Given how strong a bull bar last year was, it’s more likely this year will close around 12208 or above than far below it.
The Daily NASDAQ chart

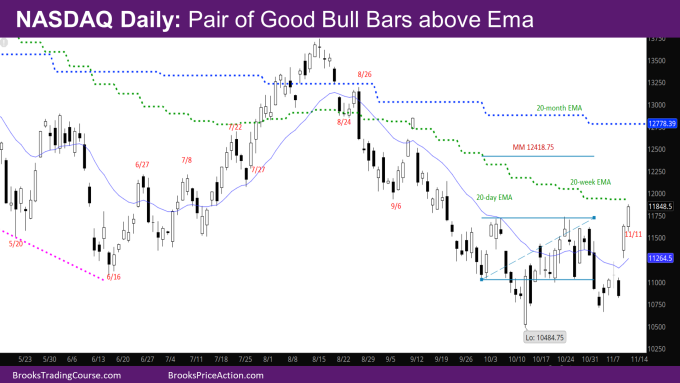
- Friday’s NQ candlestick is a big bull trend bar closing just below the weekly EMA. It’s a good follow-through bar to Thursday which closed far above the daily EMA.
- This is the first pair of good, proportionate bull bars closing above the EMA since back in July.
- The market is again trying to break above the neckline of the inverse head and shoulder (IVH) with the neckline at 11721.5. It would put the target at 12418.75 using the left shoulder.
- Using the head, the target would be around the monthly EMA. Both are realistic targets before the end of the year.
- The bulls need to create a good bull bar again next week to confirm the breakout above the neckline.
- The last time the market was trying to break above the daily EMA from a new low was in mid-June to mid-July. Compared to then, there are much fewer bull bars in this reversal since mid-October, which makes the breakout mentioned above less likely. The market may have to go more sideways and create more bull bars, and then attempt a breakout again.
- The bears see the market in a trading range, and its near the top of the range and near resistance – weekly EMA. They will fade the highs here to try and reverse the market here.
Market analysis reports archive
You can access all weekend reports on the Market Analysis page.

