Market Overview: FTSE 100 Futures
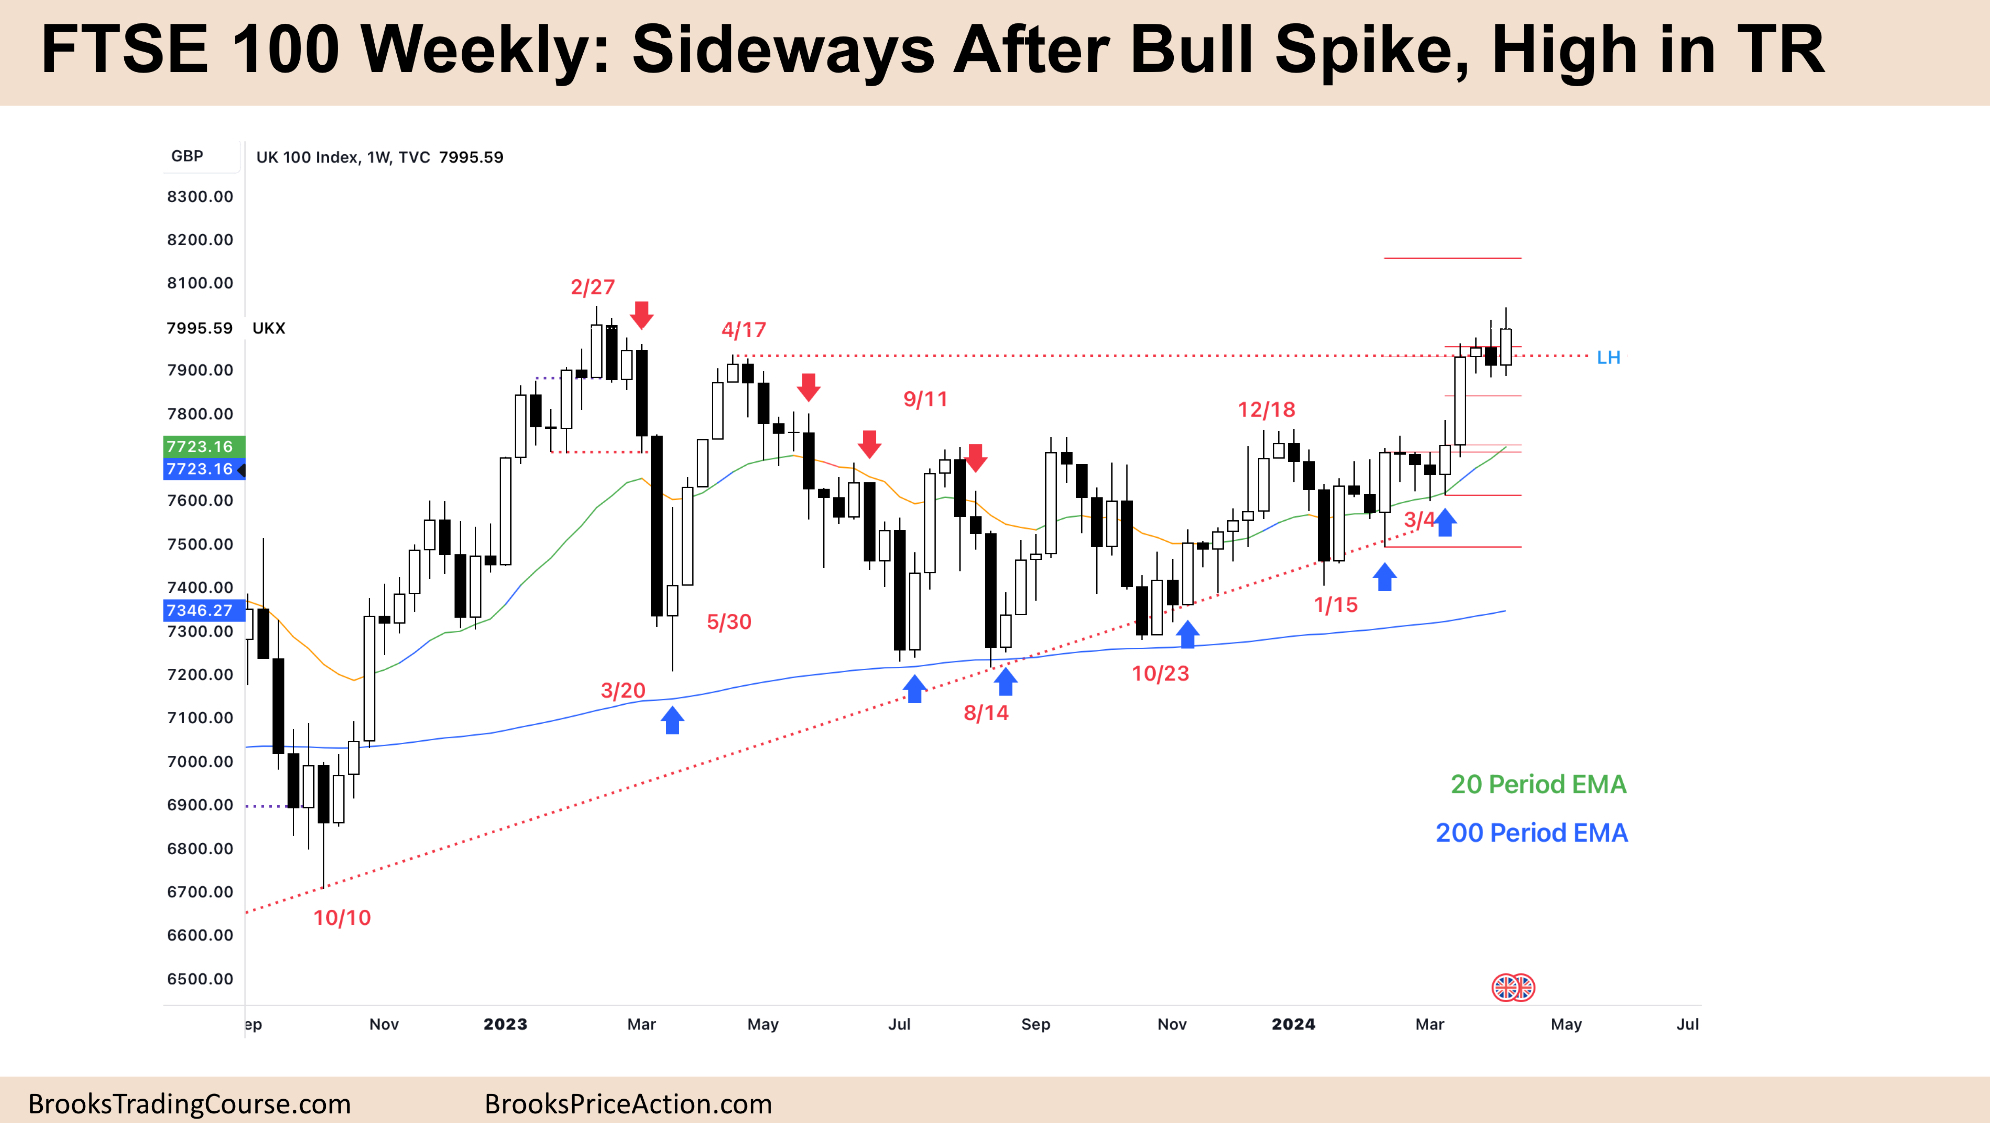
FTSE 100 futures went sideways to up last week high up in a long-term trading range. We were in breakout mode for a long time and then got a strong bull breakout so we should get another leg up at least. Bears want to fade the highs of the trading range but do not have a good signal yet. We are always in long.
FTSE 100 Futures
The Weekly FTSE chart

- The FTSE 100 futures chart last week was a bull bar with a tail above last weeks bar, but with a close below last week’s high.
- Most traders will see it as a trading range.
- It was nearly an outside bar so will probably trade like one as well.
- Bulls see a spike up from the MA and expected the first reversal to be minor. It was.
- Last week was an outside bar, a trading range on the LTF. Trading ranges act like continuation patterns in strong trends.
- Most traders expect the spike to turn into a spike and channel and it looks like we are in the channel phase.
- In the channel phase, bulls buy and scale in lower. Often buying weak bear bars like last week.
- As the channel continues, bulls will likely buy midpoints and below bars until they think it is time for a correction based on price action.
- The bears saw a spike / climax up to the top of a trading range. They were looking for a 2nd entry short here. They got one bar in the prior week but it did not trigger the sell below it.
- There are measured move targets so unless next week can do something to make bulls give up we will probably go higher.
- Always in long so traders should be long or flat.
- Expect sideways to up next week.
- Its common for price to hit support or resistance and go sideways. It is a logical place for orders to be sitting. But once the trade is live and bars are printing, each trader is managing expectations.
- The bears have little risk and big reward – so low probability. They will likely give up or scale in to increase probability.
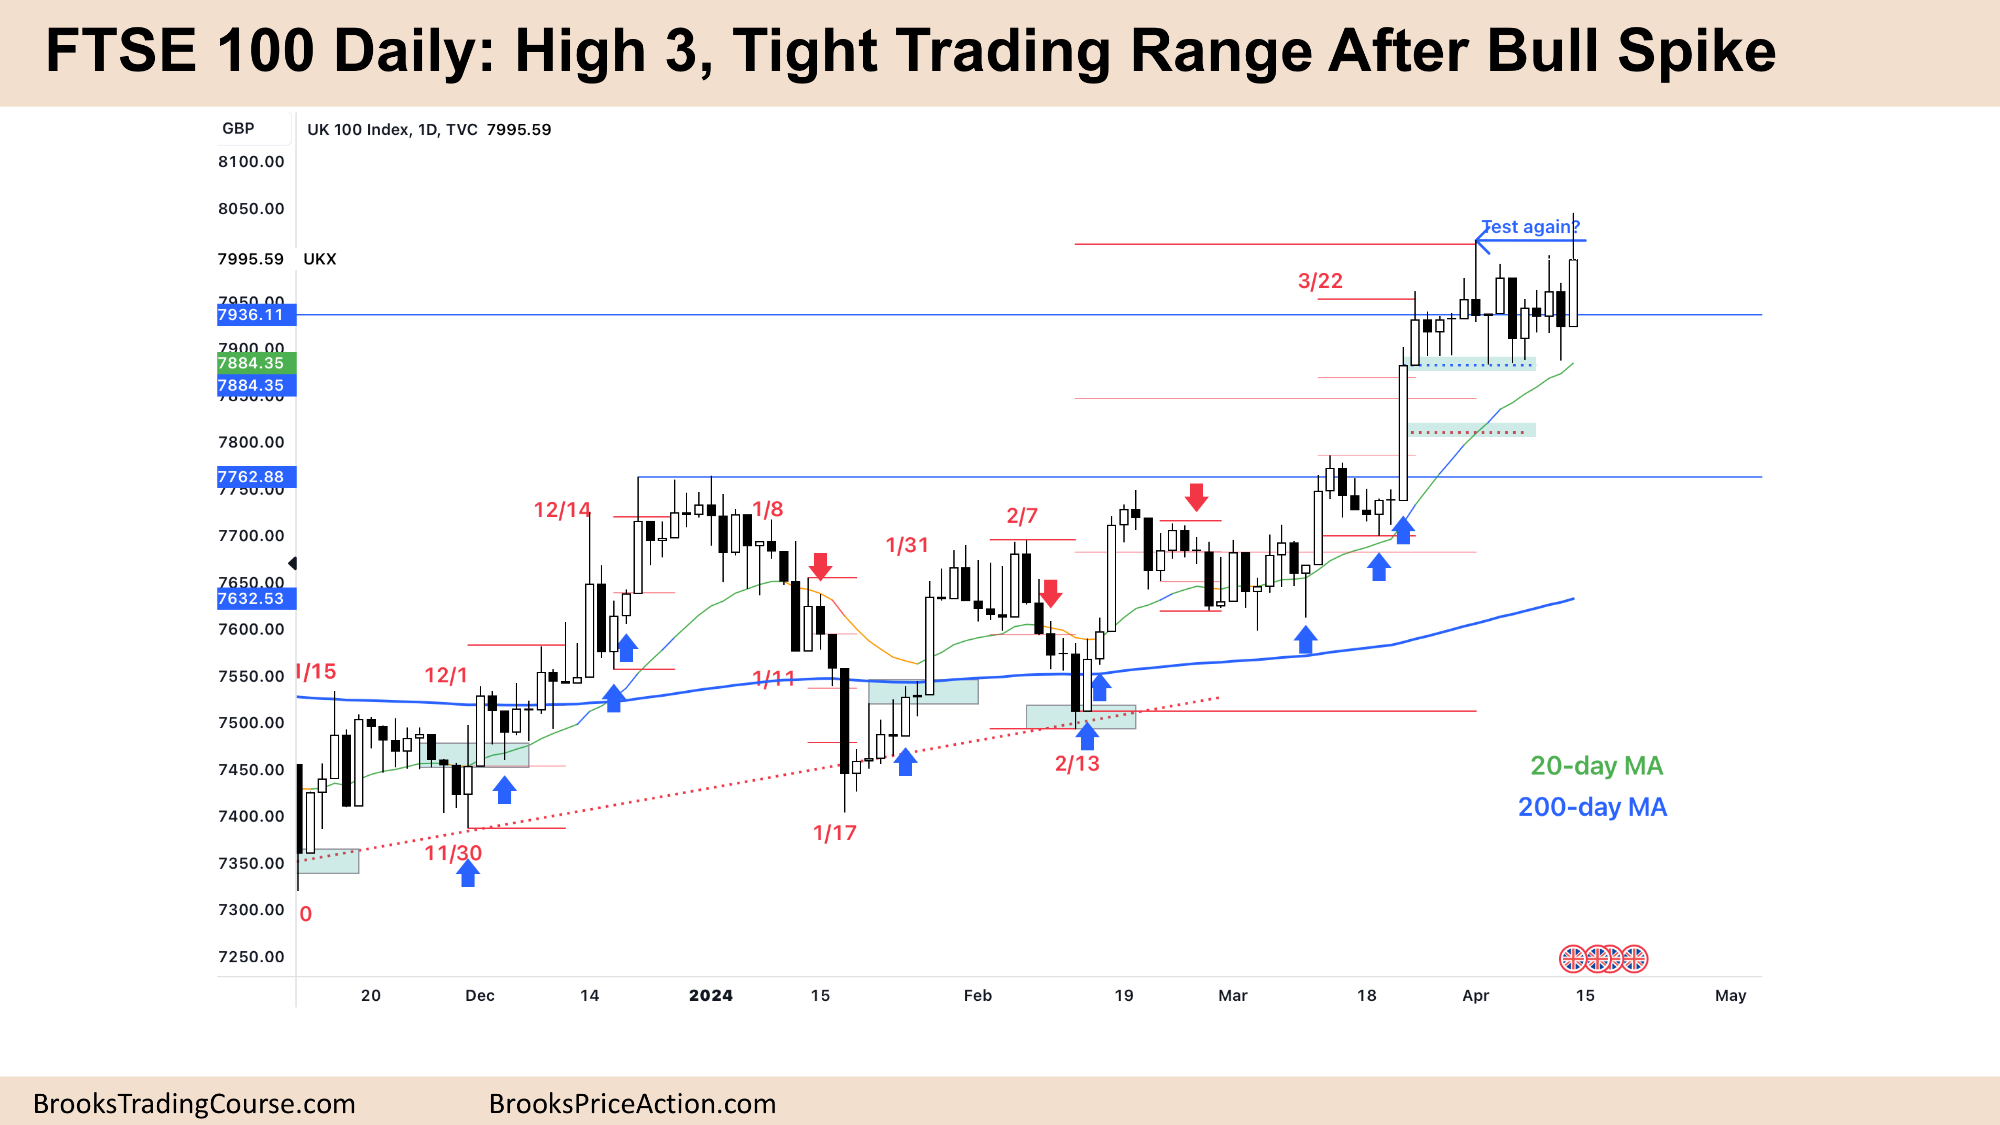
The Daily FTSE chart

- The FTSE 100 futures last week was a big bull bar with a tail on top testing the prior high.
- We said last week in a bull spike and channel, traders enter during the lows of the channel and take profits at the high which we did all week.
- The bulls see a spike and channel but a tight trading range here. They don’t want it to go on for too many bars or their probability starts going back to 50/50.
- Good close but also not that good. Below Wednesday’s high was a surprise.
- If you squeeze your eyes you can see a wedge bottom or at least 3 failed attempts to reverse.
- But this signal bar is probably a buy the midpoint or wait on Monday to see if we gap up.
- You can also BTC if you are willing to hold more size to add on lower or higher.
- Bears see a tight trading range and made money selling above bars. But is this the best trade you can find in this environment?
- Look at shaved tops and bottoms of bars.
- Friday did not go below the close of Thursday. That tells you that more traders were waiting for a good buy area and took it.
- If traders are buying bad bears bars, then you probably want to be a bull!
- We are near the all-time highs and so your risk/reward is very good but probability is very low if you are shorting right now.
- Always in long so traders should be long or flat.
- Expect sideways to up next week.
Market analysis reports archive
You can access all weekend reports on the Market Analysis page.

