Market Overview: FTSE 100 Futures
The FTSE futures market dipped below the low of a prior bar last week, a FTSE 100 pullback in a bull Micro Channel. We said last week there would likely be buyers there. We are always in long, but after 12 months in a trading range, a strong reversal here could move back quickly as the breakout fails. Bulls want a bull flag and another leg up. Bears want a good sell signal and follow through.
FTSE 100 Futures
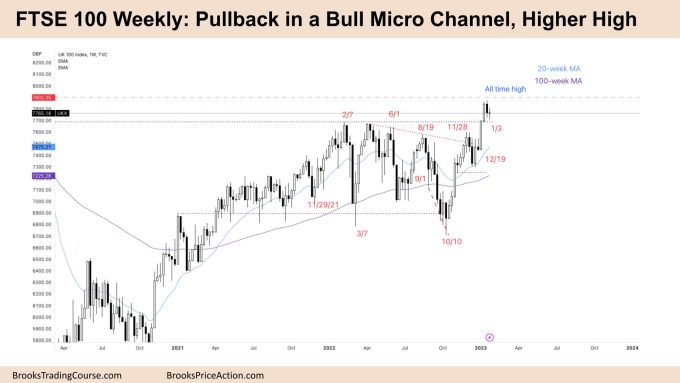
The Weekly FTSE chart

- The FTSE 100 futures was a small bear doji last week.
- It is the second consecutive sideways bar after a bull micro channel, so we are likely always in long.
- The bulls see a breakout and a pullback in a bull micro channel – a higher high.
- The bears see a higher high in a trading range.
- Both traders expect to test back to the breakout point of the Feb 7th high to decide whether there is a continuation.
- The bulls want a successful breakout test and continuation follow-through. Then the gap becomes a measuring gap for a measured move up.
- The bears want a reversal and follow-through to create an exhaustion gap and measured move back down.
- The bulls see this strong move up as a second leg and pullback and expect a third leg because of the consecutive bull bars.
- But 80% of breakouts fail, so the bears are selling above the highs and higher, betting we will at least get back to their original entry. This is a reasonable strategy.
- If the bulls can get good follow-through and break above this pullback, it becomes a bull flag, and they expect a move up. Bears will close their positions, and we will race higher.
- The bears need to return to the November 28th high to keep the chances of a reversal likely.
- Most bulls will scale in below, betting that the breakout test will hold.
- Because we are always in long, most traders should be trading on stop entries and buy above big bull bars with wide stops and scale-in.
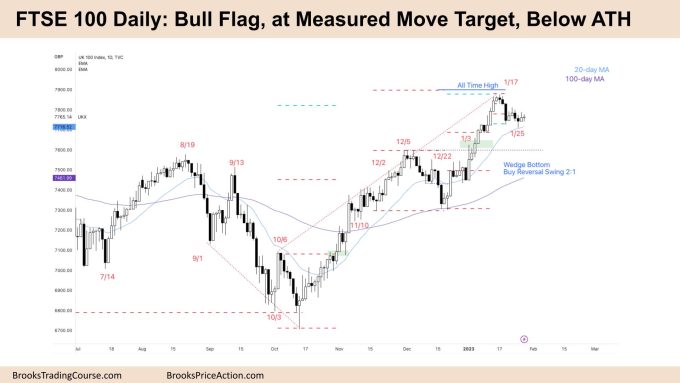
The Daily FTSE chart

- The FTSE 100 futures was a small bull doji with tails above and below.
- It is a sideways bar, a pause after a strong bull leg nearly reaching the All Time High (ATH.)
- The bulls see a bull flag above the moving average and will look to buy a High 3 near the moving average.
- There was a High 2 on Thursday, but the big tail means it might fail. We are still at the entry point.
- The bears might see the failed High 2 as a sign of weakness and look to get short.
- It’s been more than 20 bars above the moving average, so there is a 20-bar gap buy setup. Bulls will use a wide stop and scale in betting we get a trading range rather than a bear reversal.
- The bears see a failed measured move just below the ATH. They see the bears had a successful swing short last week and expect to return to the moving average.
- Both traders might be right, so we are probably in a trading range.
- Most always in traders exited after the consecutive bear bars on Jan 17th. That’s what created the bear surprise bar the day after. The bears then took profit.
- Some bulls might want a wedge bottom, three pushes down and look to scale in around the bear bar on Jan 8th. Some bears might be trapped there.
- The highest probability long trade here would be a bull bar closing above the bear trend line and getting follow-through for a move up – taking part off at 50%.
- Selling here is a scalp only as likely buyers at the moving average.
Market analysis reports archive
You can access all weekend reports on the Market Analysis page.

