Market Overview: FTSE 100 Futures
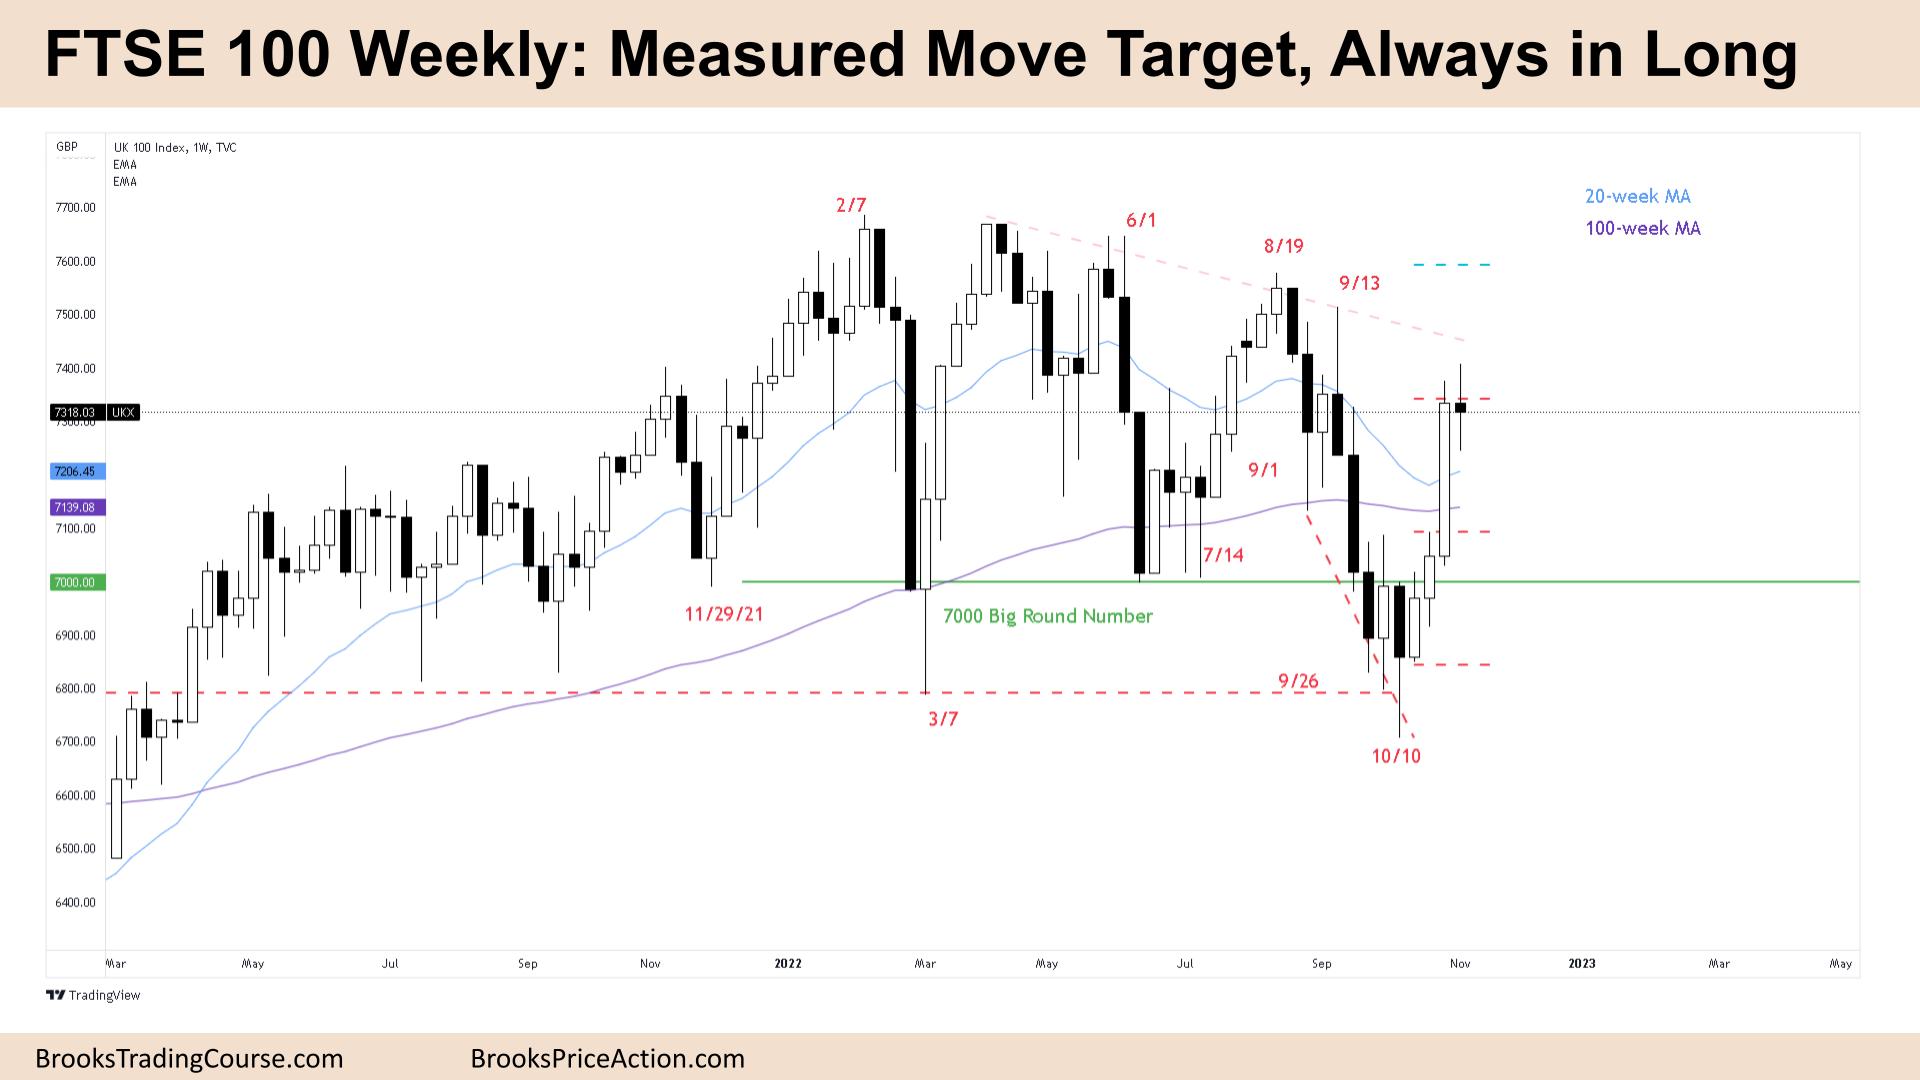
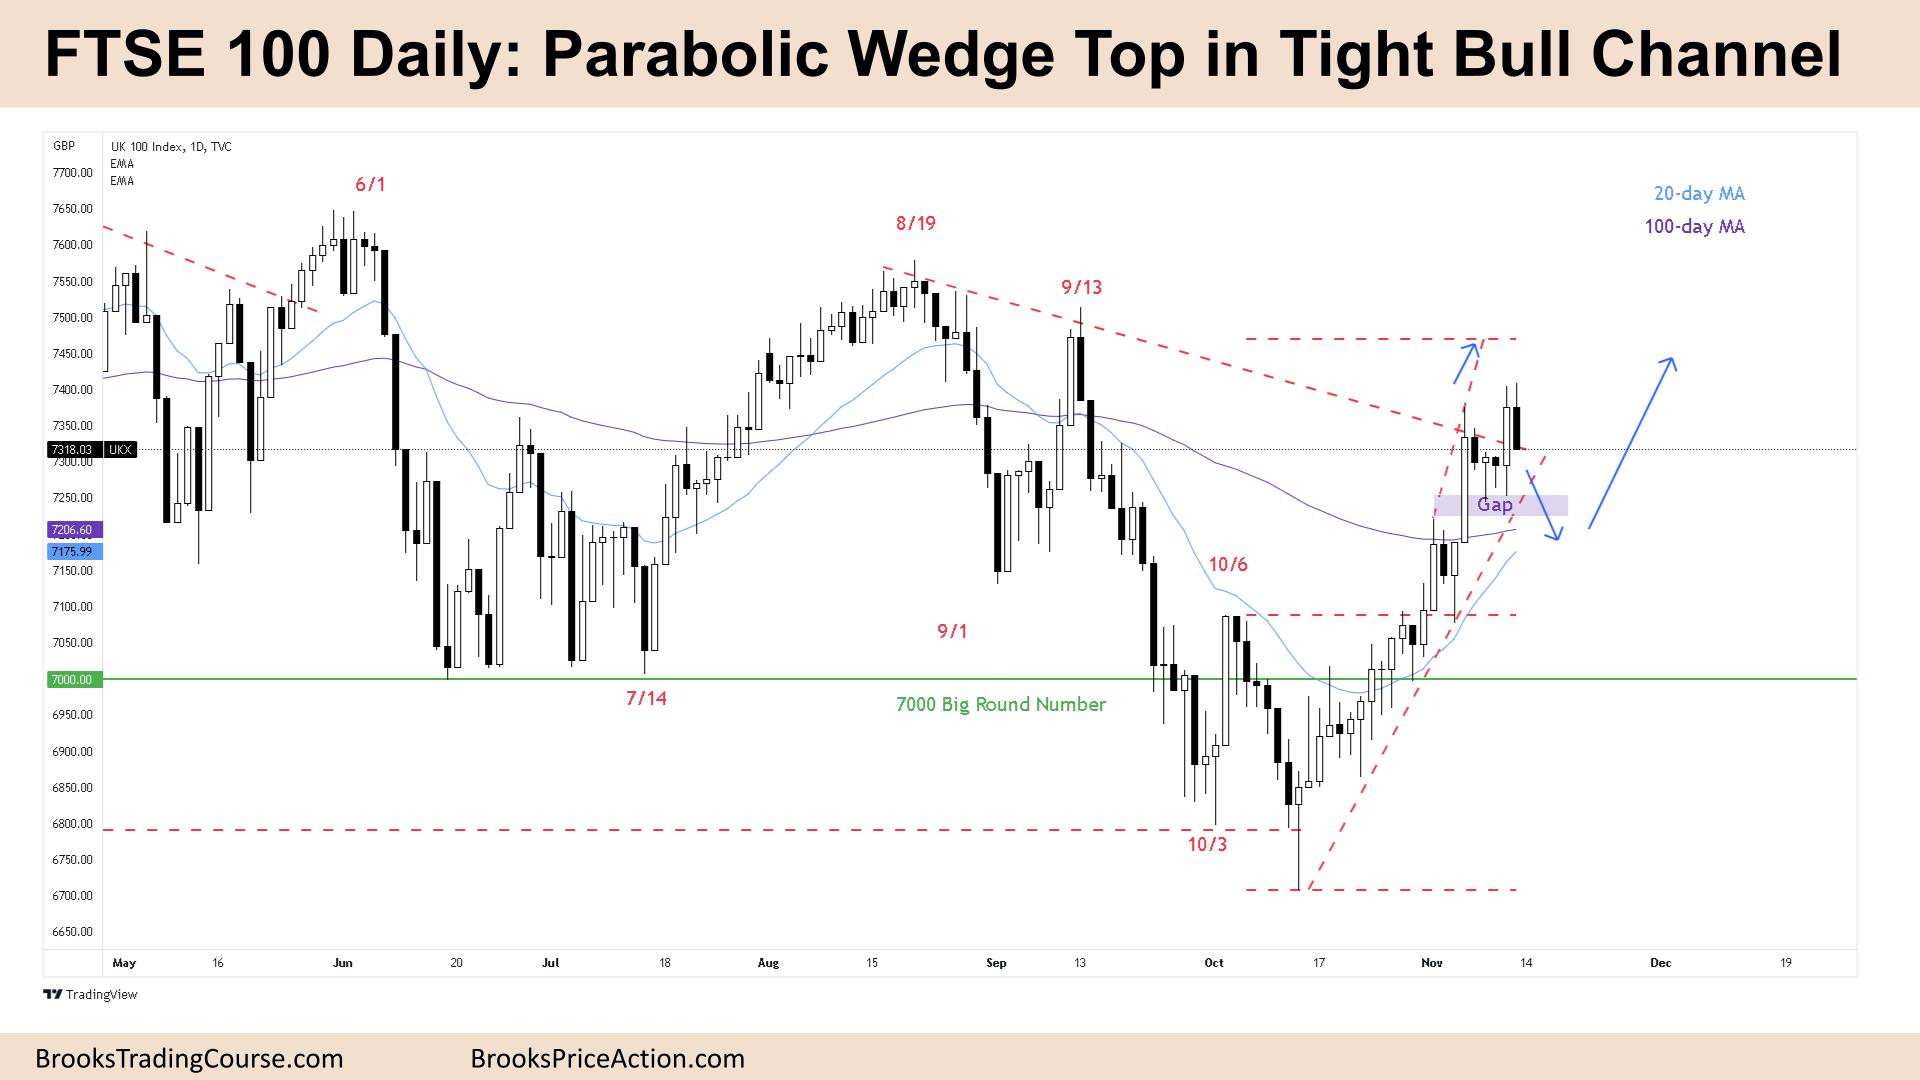
The FTSE futures market paused last week at a FTSE 100 measured move target, and we are still always in long. Although sideways on the weekly, the daily chart is a small pullback bull trend, nearly parabolic. The higher we get, the more bears will get short, but currently, no stop-entry sells have worked, so most traders should only buy. The bears have a daily double top and good bear bar Friday, so we will see if they can get consecutive bear bars on Monday.
FTSE 100 Futures
The Weekly FTSE chart

- The FTSE 100 futures was a bear doji bar last week, pausing at a measured move target.
- It is a 5-bar bull micro channel, so the first bar to go below the low of a prior bar is likely to find buyers.
- It is a doji, so neither a great buy nor sell signal. Limit order traders will be above and below the bar – but we are always in long, so most traders should only look for buys.
- The week prior was a big bull bar closing near its high, a BO bar and completed a measured move target to let trapped bulls get out breakeven, so traders expected a pause here.
- For the bulls, it is a spike, a strong first leg, and with three consecutive bull bars, most traders expect at least a small second leg sideways to up.
- The bulls want to create an expanding triangle above the August 19th high. But with so many sell signals, they might need to create a lower-high first.
- Then the bulls can see a lower-low major trend reversal but need a higher-low to convince traders we can break out of the 2-year range.
- The bears see a lower-high, high in a trading range where the math favours selling. Nothing to sell yet, so they need a sell signal. They see the prior week as a buy climax and will look to scale in above the high of bars.
- If you have to be in, better to be long or flat. Bulls can exit below a bear bar, closing below its midpoint.
- The swing target – 2x the risk from the swing buy would be the August 19th high. Expect pullbacks, perhaps a wedge top, to get there. Remembering 80% of breakouts fail, so better to scalp out while in the trading range.
The Daily FTSE chart

- The FTSE 100 futures was a bear bar closing on its low, so we might gap down on Monday.
- We are always in long, no consecutive bear bars. Traders are buying for any reason, and so should we. It is the second reasonable sell signal, however, so better to wait for a buy signal around the moving average, a High 2.
- For the bulls, it’s a tight bull channel. The trend line is steep, and they are buying pullbacks.
- Traders will expect two legs sideways to down to give the bulls a rest, but the first reversal should be minor.
- We are close enough to the measured move target from the lower range breakout we might need to get there before bears see strongly.
- For the bears, it is a deep pullback from a lower-high major trend reversal, a broad bear channel another lower-high.
- They see a parabolic wedge top and are looking to short a double top, but so far, all sell entries have failed. When you see a trend and one side is unable to make money, you are likely in a small pullback trend and only trade always in.
- There are 16 daily bars above the moving average, so we might need to go back there soon. Most traders will expect buyers there again. Traders have been paying above average until now.
- Friday might be the second push of a wedge, bears are more likely to short below a bear bar closing on its low. It’s the second sell signal high in a trading range, so some bears might take a chance and look to sell higher.
- With the gap below, it’s a reasonable target.
- Most traders should be long or flat.
Market analysis reports archive
You can access all weekend reports on the Market Analysis page.

