Market Overview: FTSE 100 Futures
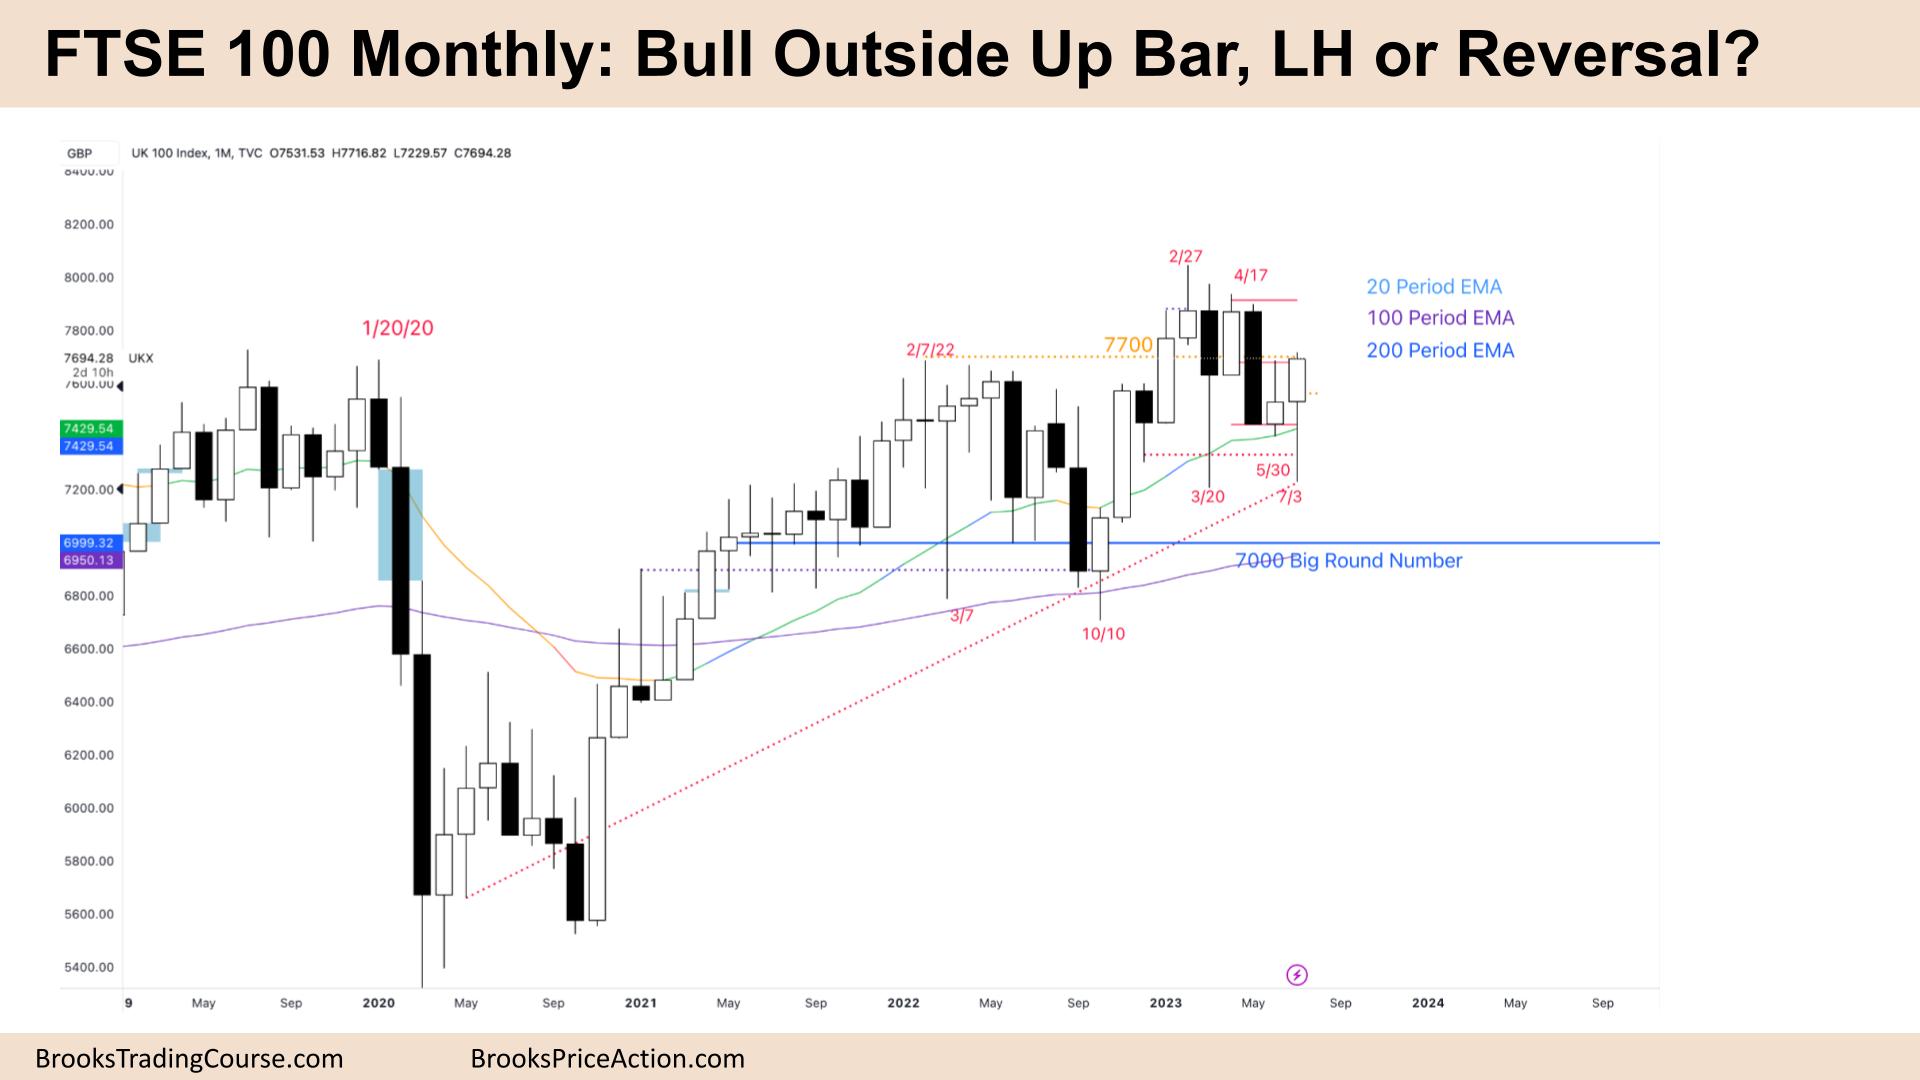
The FTSE futures market moved higher last month with a bull outside up bar – though I’m writing it with one trading day to go! Pending a collapse on Monday (10% chance?), we are closing at an important level – 7700, which is 10% above the 7000 Big Round Number and the prior TTR high. The bulls need this to close above last month for a buy signal and move back to the highs. The bears want this to be a pullback and second leg down. Expect sideways to up next month.
FTSE 100 Futures
The Monthly FTSE chart

- The FTSE 100 monthly chart was a bull outside up bar closing on its high.
- It closed above the prior month, so its consecutive bull bars above the moving average – a buy signal.
- It is also a reversal and followthrough as it triggered the sell below May and June and then reversed above.
- The bulls see a bull channel, maybe a small pullback bull trend. Every bear bar has been a great place to buy – May was no different.
- It is also reversing off of a trendline. The bears will see it as a break, and now we are testing the BO point.
- The bears see a failed BO above. TR, a possible wedge top and a second entry short, but May was too low. Most bears would wait for resumption to fail before shorting – above the high of this bar could be a good place.
- It is an outside up bar, but the bear BO was stronger – that makes it confusing – many bears will sell above, betting there is a small second leg.
- But the trend bulls will buy strong bars off the EMA – next month is important.
- Bears need an OO, an outside down, to trap bulls here and move down further. Traders should watch the weekly chart for confirmation – otherwise, trading range price action is likely.
- The bears that sold below May had to sell the middle of the bar to get out breakeven. Others waited for the bad buy signal last month and sold above it. They made money.
- If bears are making money, the bull trend is weak, more likely a trading range.
- Bulls that got stuck in April bought the close of May and made money. So more bulls bought under the bull bar last month ( a weak sell) and made money.
- My short-term target is the high close of April – which was reasonable in a bull trend.
- The pain trade is down – an OO and second leg, but a low probability (say 30%) of getting below 7000.
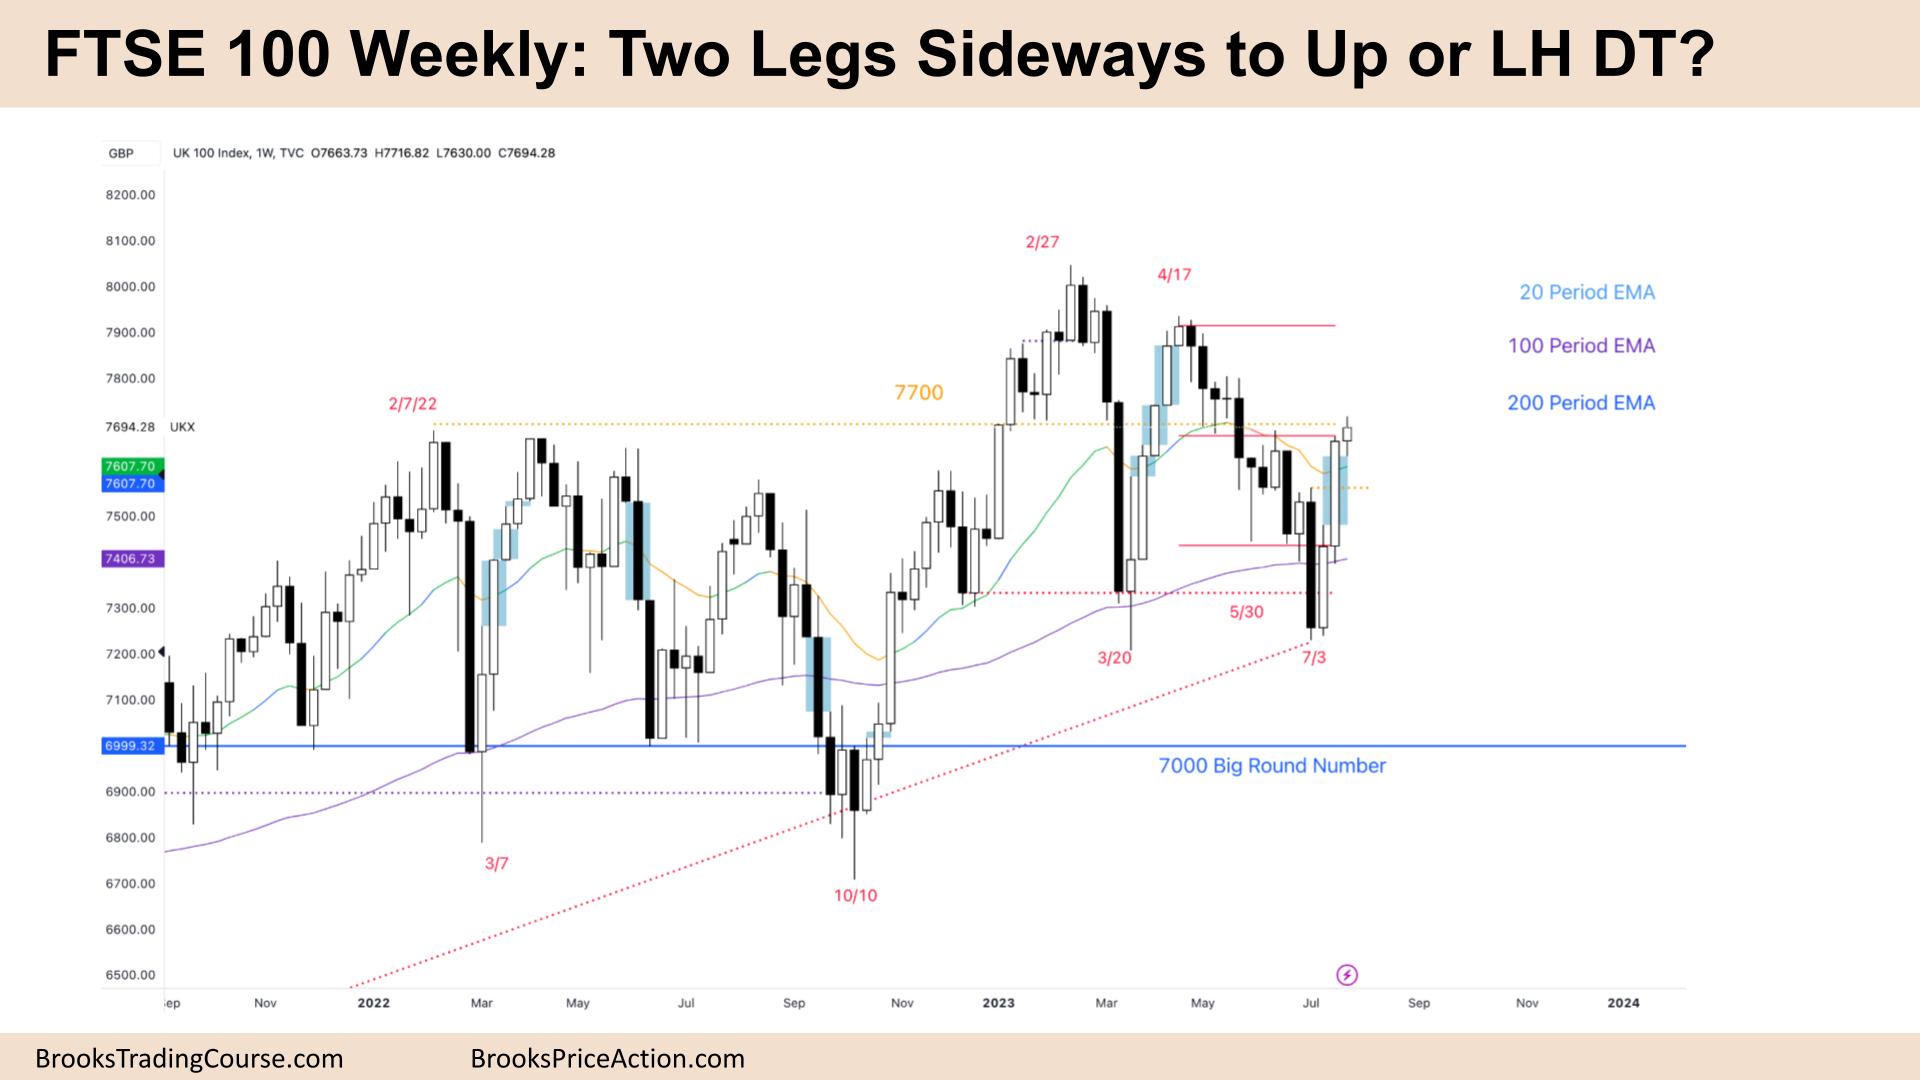
The Weekly FTSE chart

- The FTSE 100 futures was a small bull doji closing above last week’s bull bar.
- It is the third consecutive bull bar with a gap so it is a bull microchannel. Traders will expect a second leg sideways to up.
- The bulls see the bears had two reversals from the new ATH, and so it is a form of High 2. We said a few weeks ago there would be buyers at the 100-week MA, and there was.
- The bears see a LH DT, a possible bear MTR and are looking for a larger move down. But bear trends don’t have such strong bull microchannels. The best they can get here is a trading range.
- The bulls will buy below the low of the last bar in the Microchannel (MC), which might be last week or the week before.
- Bears got stuck above their last strong bear bar, a sell climax. That was a reasonable short which failed. Limit-Order buyers will be there as well – if we get there.
- Most traders should be long or flat.
- Buying at the MA in April and May is a reasonable strategy in a bull trend, and those bulls got stuck – they have now potentially all been let out. So we might go sideways here next week.
- Bulls want a pullback and second leg up which is more likely than a strong reversal down at this stage.
- Scale in bulls also avoided a loss by buying the bull bars low in the range.
- It is a trading range, so expect disappointing follow-through and traders fading as we get into the extremes of the range.
Market analysis reports archive
You can access all weekend reports on the Market Analysis page.

