Market Overview: FTSE 100 Futures
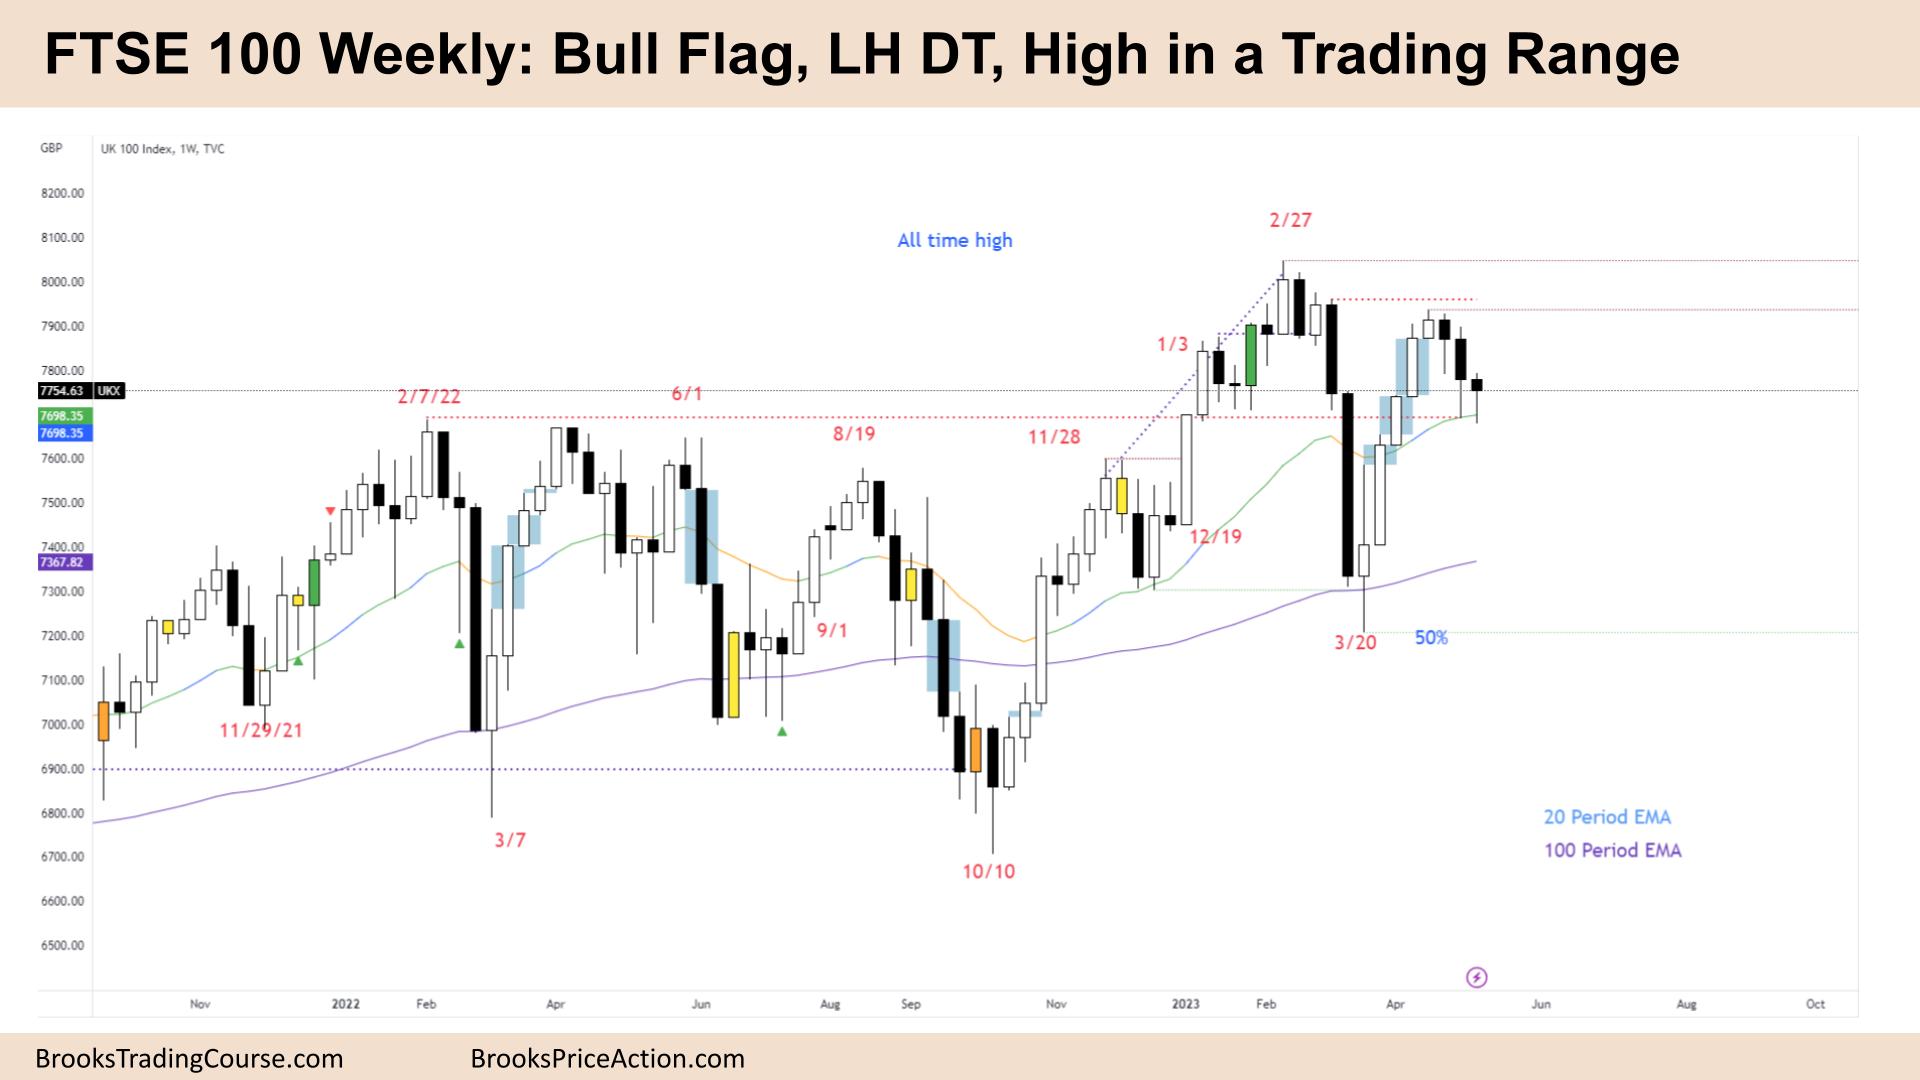
The FTSE futures market formed a FTSE 100 bull flag with a lower high double top (LH DT). The price moved lower, but the tails tell us bears were scalping and ran into the scale-in bulls. After a strong micro channel, traders bought below the low and will buy 50%, expecting a test of the high. Bears need one more bar to turn it into a trading range – preferably closing below the MA. Now three bear bars, so they should get a second leg.
FTSE 100 Futures
The Weekly FTSE chart

- Last week, the FTSE 100 futures was a small bear bar, in a possible bull flag.
- The bar closed in its upper half so that some computers will see it as a bull bar.
- For the bulls, it is a bull flag, a pullback after a strong leg up from the 100-Week MA. It is also a Micro DB. Both bars failed to close below the MA, a sign of strong bulls.
- After a 5-bar bull, micro channel traders have a high probability of trade buying below its low and a 50% pullback.
- The bears see a LH DT, a possible head and shoulders top, and want to break below the neckline for a measured move down.
- The bulls want a High 1 buy, but it is a lower probability after a bear bar. Two consecutive bull bars would be needed to convince traders.
- Bears want an outside down bar – to trap bulls in above and then reverse down strongly, closing on its low. Their first target will be closing the gaps below.
- Closed gaps are a sign of a trading range. The bulls want to keep them open to convince the traders that the break above the 18-month trading range is still viable and move higher.
- But three consecutive bear bars are disappointing. Now the bears might get a second leg as well. If bulls need a second leg and bears need a second leg, we will probably form a triangle.
- The prior week was a good bear reversal bar that trapped bulls above, creating a resistance layer above the highs.
- The prior week was a climax bar, and we said the following bar had a high chance of being an inside bar, which it nearly was.
- We can expect volatility expansion in the next two weeks.
- Expect sideways to down next week.
The Daily FTSE chart

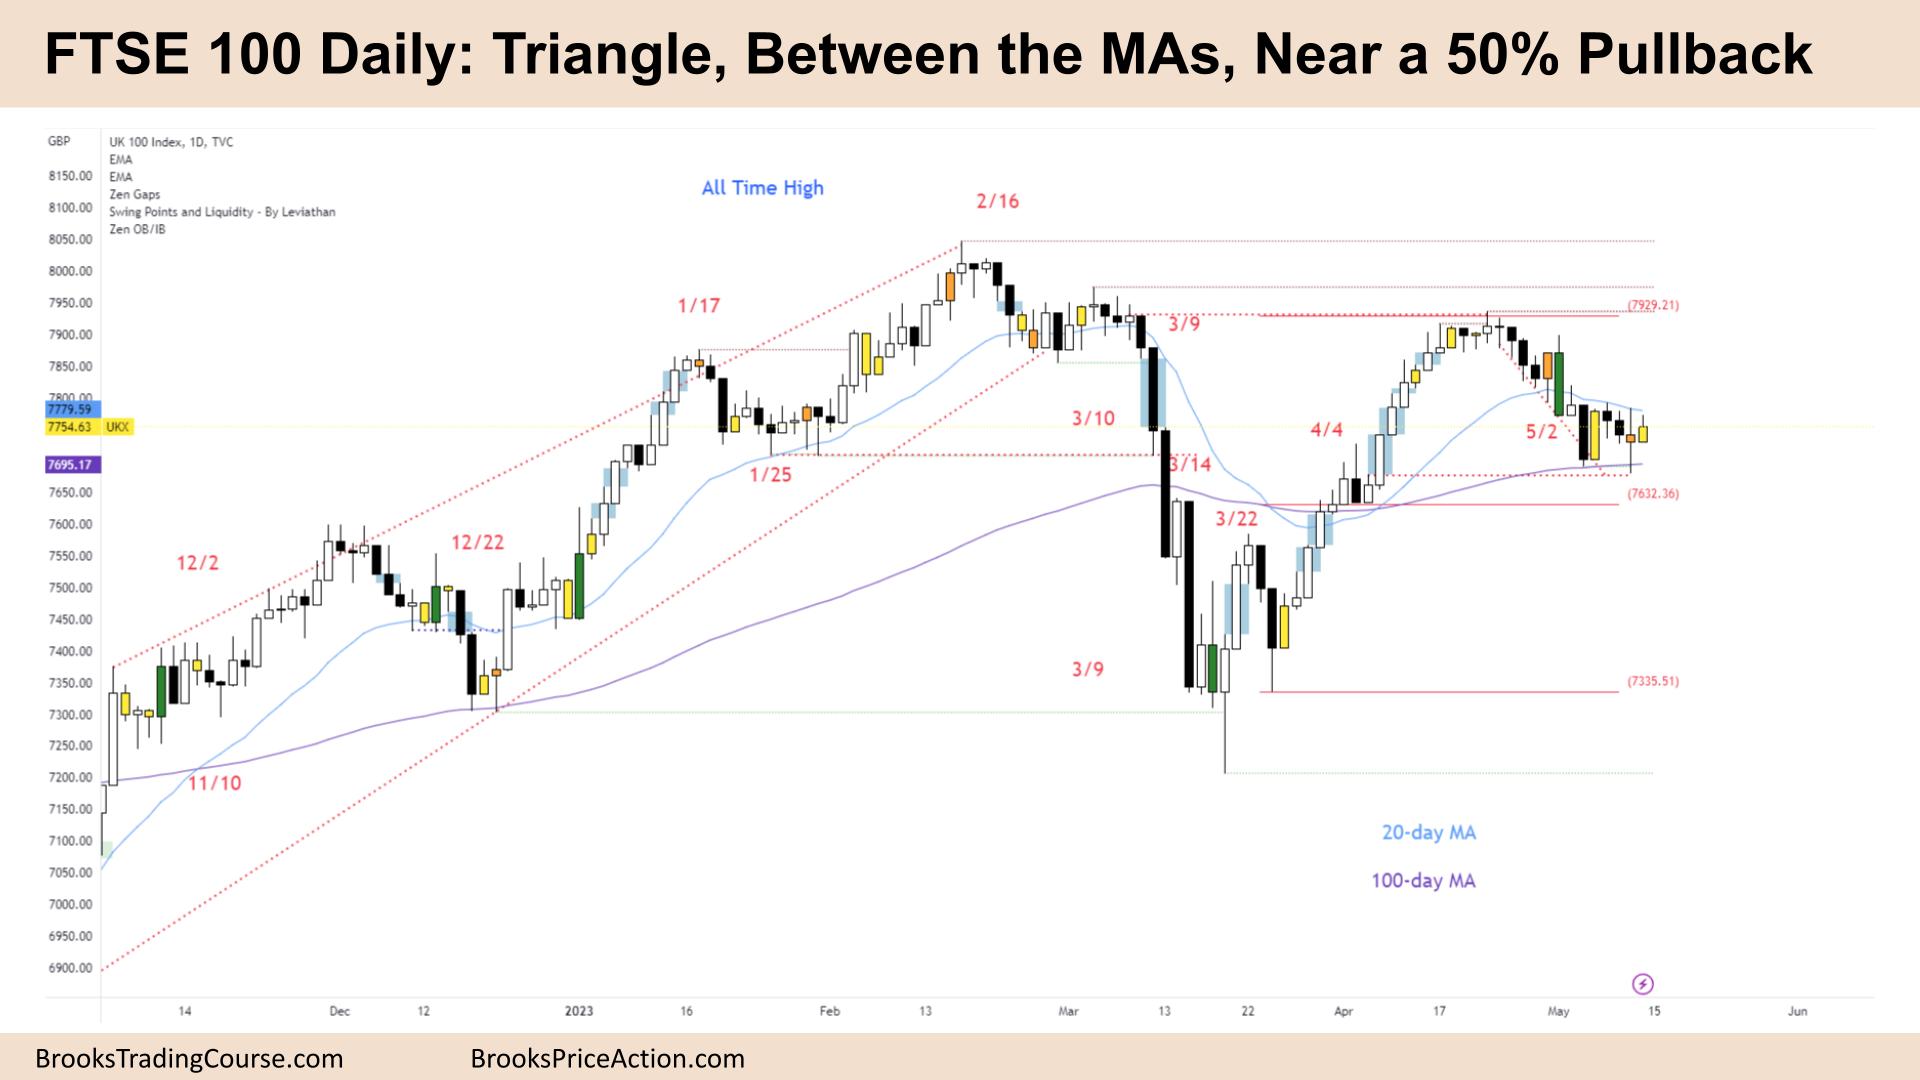
- The FTSE 100 futures daily was an inside bar on Friday which is breakout mode.
- In BOM, the first breakout fails 50% of the time. So most traders should wait for strong consecutive bars above/below the moving average for guidance.
- The bulls see a strong micro channel testing the breakout point from the 3-month bull trend. Once they closed the gap, the price turned down.
- The bears see a bear surprise and a deep sell climax. The test of the breakout point confirms the move for the bears.
- When there are two equally reasonable moves, it is a trading range.
- Also, that the pullbacks are larger than 60% increases the chance of a trading range.
- It’s a possible bull flag on the weekly chart which will reduce sellers below bars.
- The outside down bar on May 2nd should have been support as it broke well above the previous bar. But it failed. So now there is resistance at that level.
- The High 2 will probably fail above it and reverse down now. But the probability is typically 50% at best in the middle of a trading range.
- It’s a triangle pattern and an ioi – inside-outside-inside pattern between the moving averages. So it is breakout mode (BOM.)
- Both moving averages are flat, so expect more tight trading range price action (TTR) next week.
- Thursday and Friday form a strong reversal pattern – on Wednesday, the bulls bought above Tuesday and got trapped.
- TTRs can also get strong moves, but they have a high chance of failing – look to see if Monday is unreasonably strong to fade.
- A bull flag can often have a failed breakout below before a strong move up.
Market analysis reports archive
You can access all weekend reports on the Market Analysis page.

