Market Overview: FTSE 100 Futures
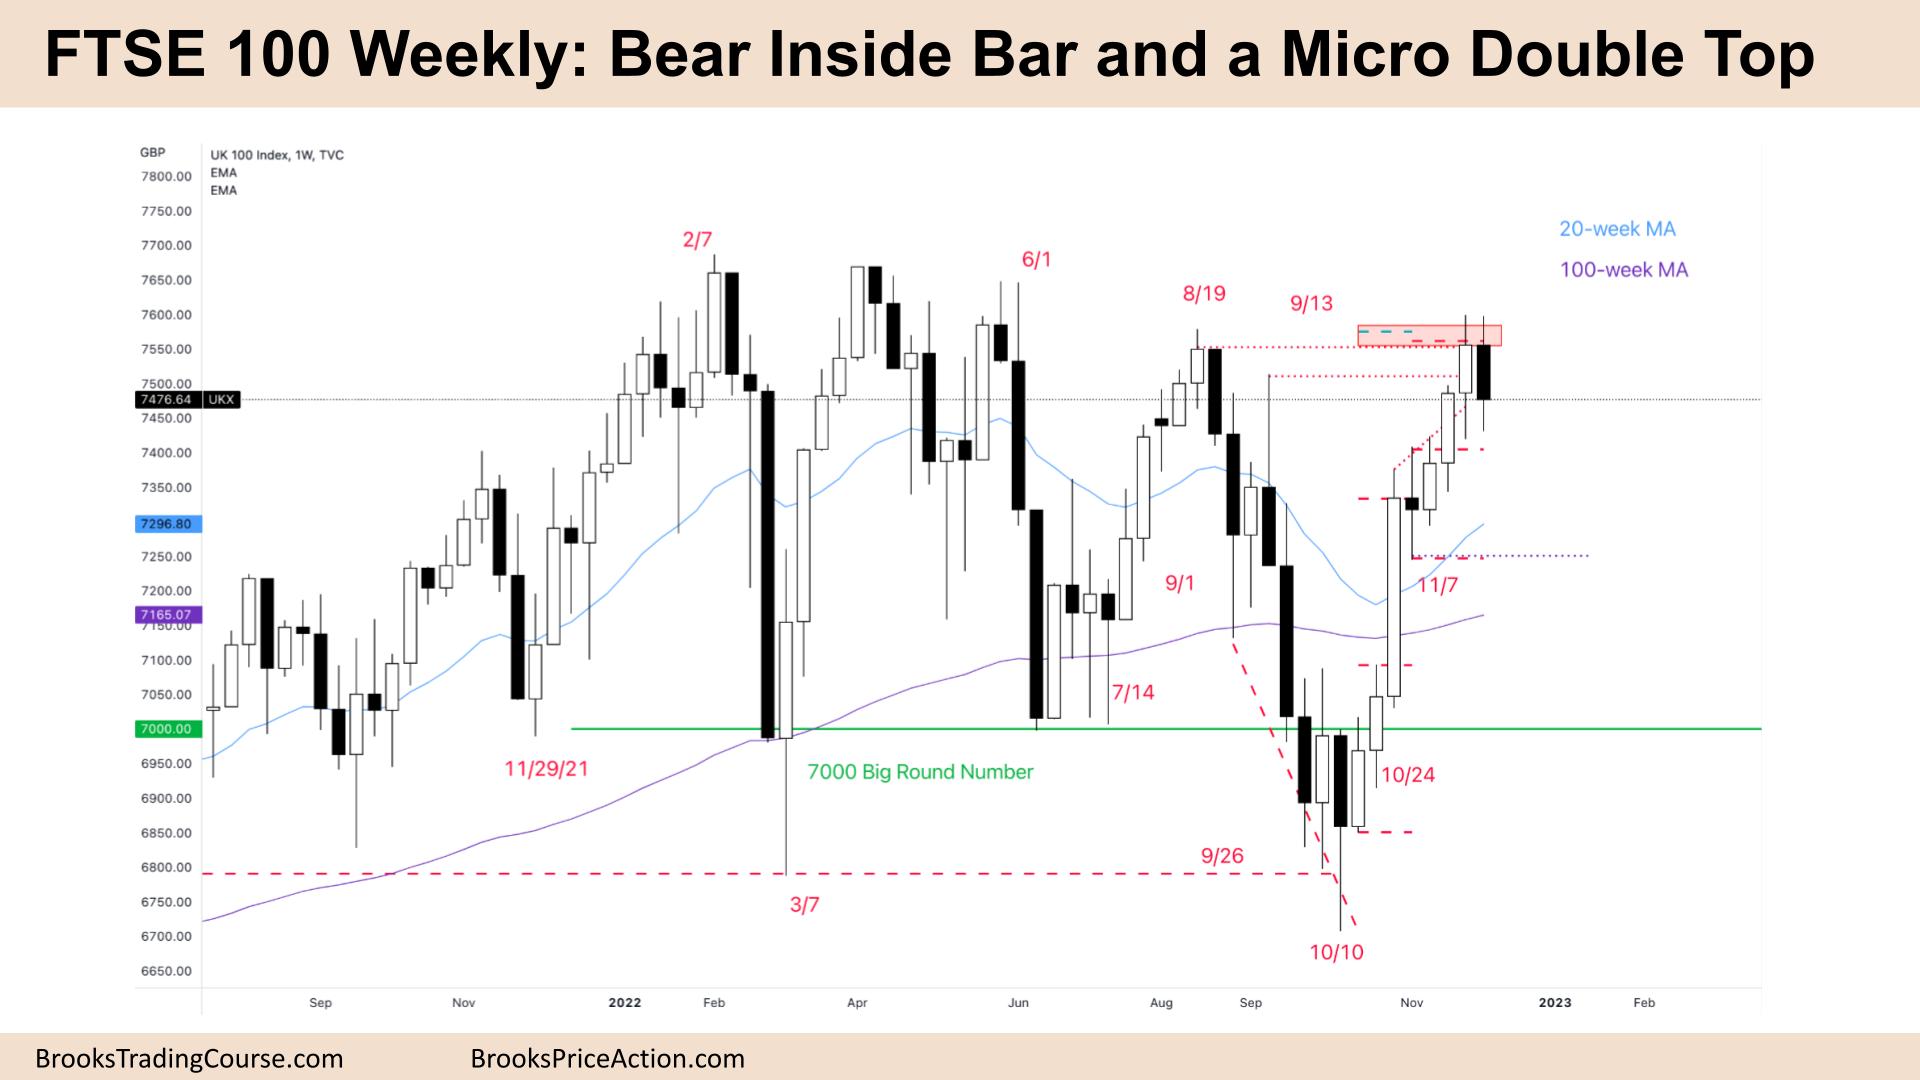
The FTSE futures market was a FTSE 100 bear inside bar and micro double top. It was a pause at 2 measured move targets and a possible double top. But the bull leg is very strong, and with so much urgency, bulls could not even buy below bars. It is likely this leg will have some more upside after a pullback.
Bears want to create another top to keep the price in this trading range and are starting to make money selling above highs.
FTSE 100 Futures
The Weekly FTSE chart

- The FTSE 100 futures was a bear inside bar with tails above and below.
- It is an 8-bar bull micro channel, so the first bar to go below the low of a prior bar is likely to be bought by the bulls.
- We said last week that when 2 measured move targets converge, it is a reasonable opposite entry, and it worked out.
- It was the measured move for the failed wedge top. It was also the 2x swing target for the double bottom at the low end of the trading range.
- The bulls see a pullback in a tight bull channel. Both legs are strong. It is more likely we will see a little more up after a pullback.
- The bears see a double top high in a trading range and are looking for a reasonable short. A Low 2 is a better entry for them.
- If it is a spike and channel, the Nov 11th low is the bottom of that channel, but there are no consecutive bear bars. Higher probability trading is buying, but the stop is far away.
- Bulls want a pullback to the moving average and then a second leg – treating the whole move as the first leg. In that case, bears can expect 2 legs sideways to down back to the midpoint of the range.
- Bears have a micro double top, but the signal bar is not strong, so they might wait for a failed breakout or a lower low before shorting.
- Limit order bears will sell above the bar, betting we will not break out of the 18-month range.
- There are still untested breakout points below and gaps on the daily, so that might be enough to keep the move going up.
- Next week, we can expect sideways to down or another inside bar. Volatility compression might be needed before a strong move in either direction.
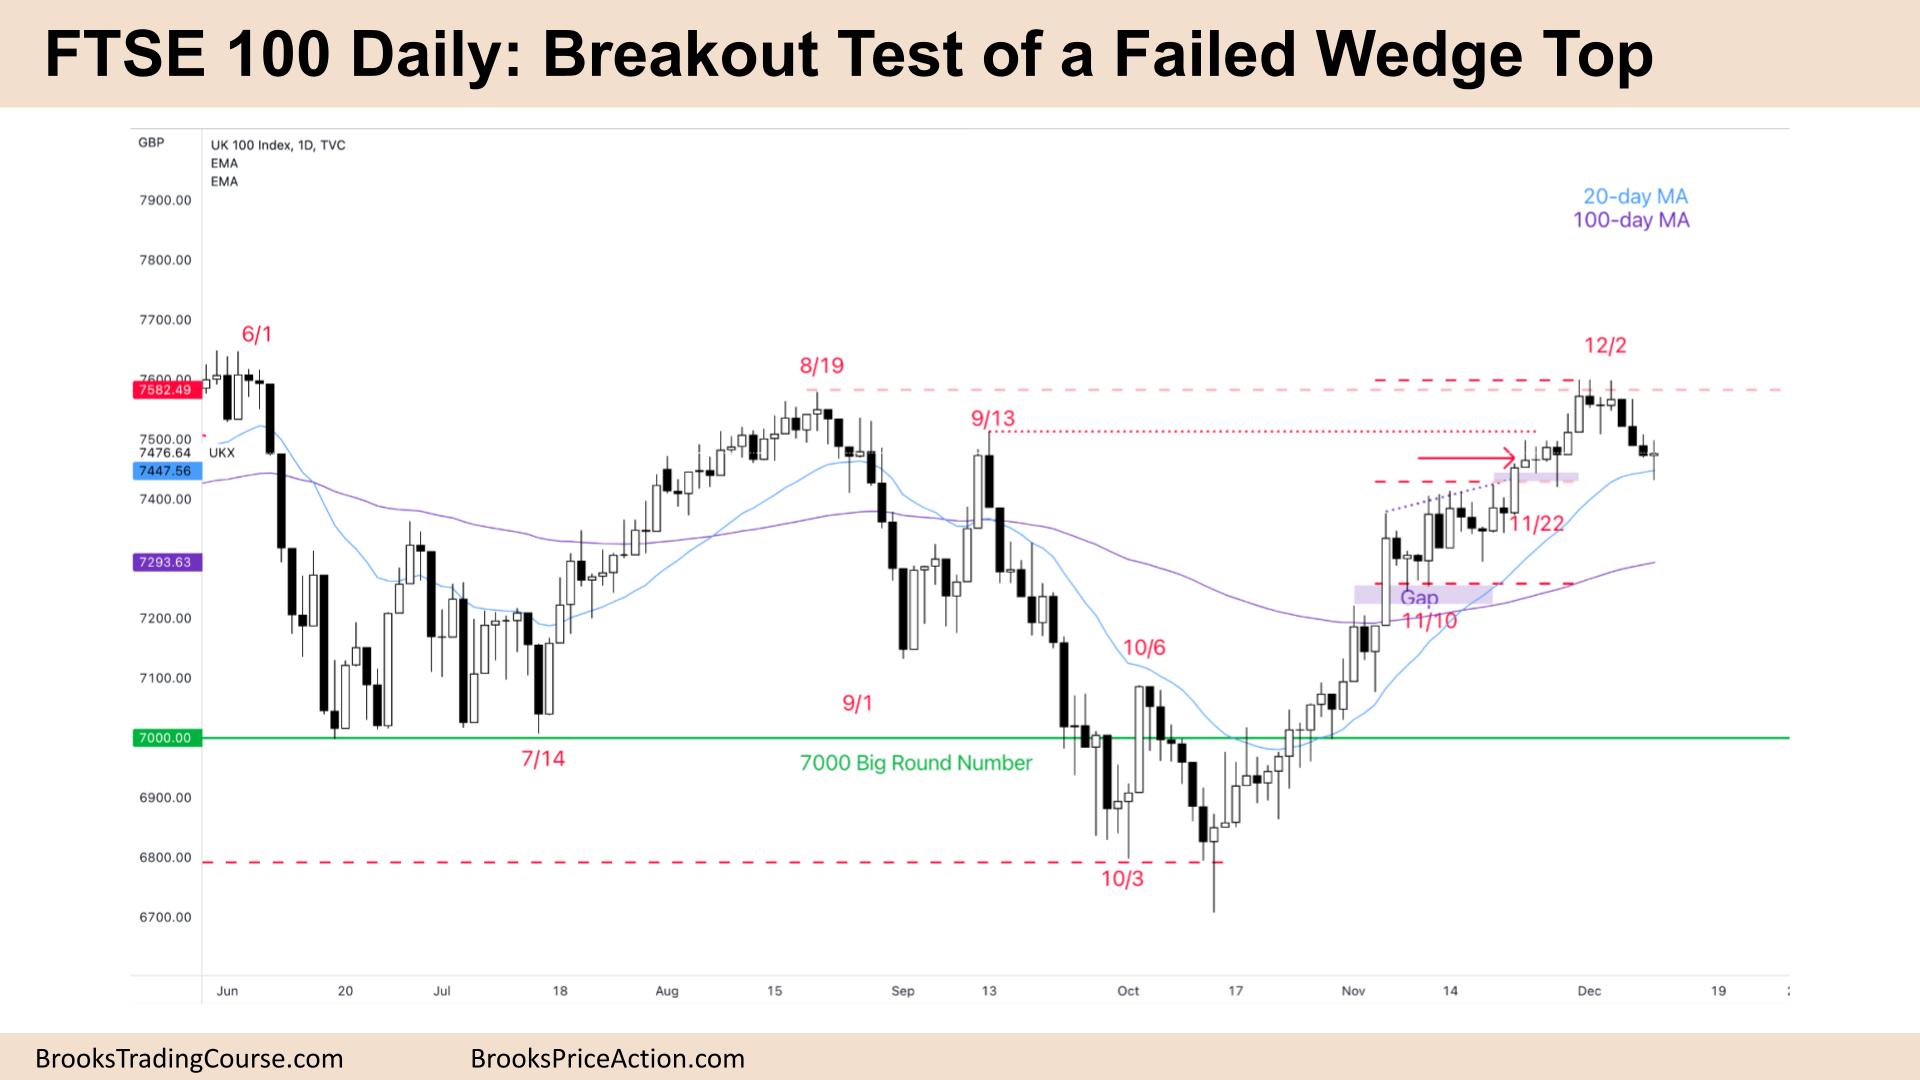
The Daily FTSE chart

- The FTSE 100 futures was a bear doji on Friday. It was a pause bar at the moving average. It was a bear inside bar on a higher time frame.
- The bulls see a pullback in a small pullback bull trend, so traders will look to enter for a continuation higher.
- They see a failed wedge top and follow-through, so they expected a measured move-up, and they got it. The target was the August 19th prior high, which was no coincidence. The algorithms play chess many moves ahead to set these up.
- The bears see the double top with August and want to prevent a break and measured move-up. They see a micro double top and a DT on Dec 3rd.
- Dec 2nd could be the first leg down, and the second leg might have ended on Friday.
- A bull doji in a 5-bar bear micro channel is not a high-probability buy setup. The bears might expect a second leg at least a little more down to test the breakout above the wedge top before the test is complete.
- Bulls might count it as a High 2 buy, but most traders should look to buy above a bull bar.
- It is a buy location for the bulls who have been paying above average for more than 20 bars, so typically, the first bar to go completely below the moving average will be bought.
- Scale in bears who sold the double at the wedge top scaled in higher and now get a chance to get out breakeven on their first entry, and a profit on their second entry. This tells you the trend is weakening and will soon likely become a trading range.
- The bears want to test back to the start of the channel from the spike and channel on Nov 10th. The bulls need to hold this to have a chance to move up to the top of the range and breakout.
- Trading ranges are confusing and tend to disappoint traders. But they close gaps and test breakout points, so we might get down there before we move higher.
- Because there are only open bull gaps and not bear gaps, it is still more bullish than bearish. A small pullback trend is more likely to turn into a weaker trend or trading range than get a strong bear leg.
- Always in traders probably exited below the double top below the strong bear bar and will look to get back in above a strong bull bar for a test of the high.
- Next week we can expect more sideways to down.
Market analysis reports archive
You can access all weekend reports on the Market Analysis page.

