EURUSD Forex: Weekend Market Analysis
The EURUSD Forex is in a pullback from parabolic wedge sell-off testing the 700-pip measured move which started in October 2020. Traders are monitoring whether the bulls can create consecutive bull bars closing near their highs or the pullback is more sideways with weak bull bars.
The leg down from February is strong enough for traders to expect at least a small 2nd leg sideways to down after a pullback (bounce), especially if the bulls are not able to create strong bull bars and the pullback is mostly sideways.
EURUSD Forex market
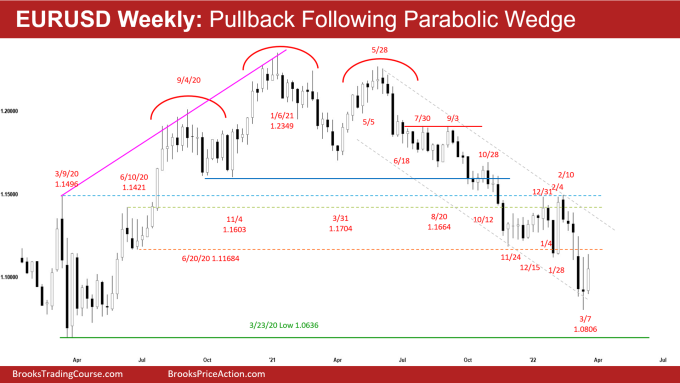
The EURUSD weekly chart

- This week’s candlestick on the weekly EURUSD Forex chart was a bull bar with a long tail above closing below last week’s high. It was mostly overlapping the 2 prior bars and was a pullback from the parabolic wedge sell-off testing the 700-pip measured move lower based on the height of the yearlong trading range (August 2020 to August 2021) around 1.0855.
- We have said that the leg down from February is strong enough for traders to expect at least a small 2nd leg sideways to down after a pullback (bounce). This remains true.
- Another bear measured move based on the height of the 4-month trading range (Nov 2021 to Feb 2022) will take them to around 1.072 which is very close to the March 2020 low.
- The bulls hope that the 4-month trading range (Nov 2021 to Feb 2022) is the final flag of the bear leg and want the breakout below to reverse higher from around last year’s low. The trading range came late in the bear trend, and that makes it a potential final bear flag.
- The bulls will need to create strong consecutive bull bars closing near their highs to convince traders that a reversal higher may be underway. That means, if next week closes as a big bull bar closing near its high, there would then be consecutive bull bars with at least one having a big body and closing near its high. That is a Bull Surprise reversal, and it increases the chances of higher prices.
- The bulls are still hoping that the entire 15-month sell-off is simply a pullback from that very strong rally in 2020.
- Al has said that the market has been in a trading range for seven years. It is now near the bottom of the range. Reversals are more likely than breakouts. Therefore, as strong as the selloff has been, it is still more likely a bear leg in the seven-year trading range than a resumption of the 15-year bear trend.
- If the bears can get a couple closes below the March 2020 low, the selloff should continue down to the 2017 low, which is the bottom of the 15-year bear trend. A couple closes below that low would probably be the start of a measured move down based on the height of the seven-year trading range.
- Al also said that with 2 sideways bars having prominent tails and the EURUSD back in the March to May 2020 trading range, the market might have to go sideways for a few more weeks before traders decide on the direction of the next leg.
- For now, the EURUSD may still be in the pullback phase for another 1-3 weeks therefore slightly favoring sideways to up.
- Traders will be monitoring whether the bulls can create consecutive strong bull bars closing near their highs or if the pullback remains sideways with weak bull bars.
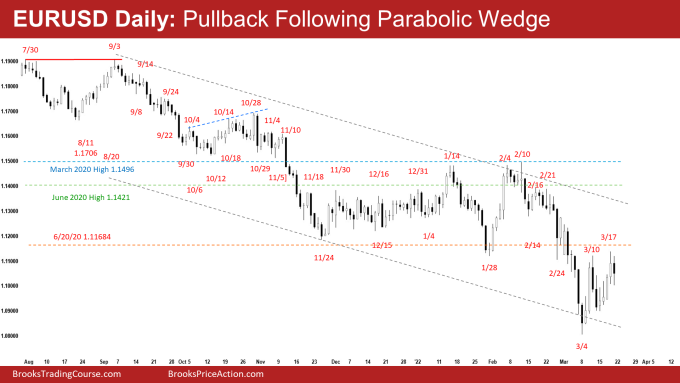
The EURUSD daily chart

- The EURUSD traded higher from Monday to Thursday testing the January 28 breakout point for the second time and pulled back slightly on Friday. Most of the candlesticks had prominent tails above.
- The EURUSD is currently in a 2-legged pullback following the trend channel line overshoot (March 4) and a parabolic wedge (February 14, February 24 and March 4).
- The bears have reached the 700-pip measured move lower based on the height of the yearlong trading range (August 2020 to August 2021) around 1.0855, but have not yet reached the 400-pip measured move based on the height of the 4-month trading range (Nov 2021 to Feb 2022) which will take them to around 1.072.
- The sell-off from February was strong enough for traders to expect at least a small 2nd leg sideways to down after the pullback.
- The bears want the EURUSD to turn lower from a double top bear flag (March 10 and March 17).
- If the pullback lasts for another 1- to 2-weeks, and the bulls get another push up but are not able to create strong consecutive bull bars closing near their highs trading back into the 4-month tight trading range, it would be the 3rd push-up and would then form a wedge bear flag. The bears would then want the second leg sideways to down to form with the next measured move 1.072 and March 2020 low as the next targets.
- The bulls hope that the 4-month tight trading range (Nov 2021 to Feb 2022) late in the trend is the final flag of the 15-month sell-off. They want this to be the start of the reversal higher testing February 10 high.
- As strong as the selloff has been, it is still more likely a bear leg in the seven-year trading range than a resumption of the 15-year bear trend.
- The pullback (bounce) is a 50% pullback of the February sell-off. The bulls will need to do more by creating consecutive bull bars closing near their highs to convince traders that a reversal higher may be underway.
- For now, odds slightly favor the pullback to continue a while more. Traders will be monitoring whether the pullback is more sideways with weak bull bars, or if the bulls start getting big bull bars closing near the highs.
- If the pullback continues to be sideways, odds are sellers will return and sell the double top bear flag or wedge bear flag.
- However, if the bulls start getting big bull bars closing near their highs, it increases the odds of a reversal higher from the bottom of the 7-year trading range.
Trading Room
Traders can see the end of the day bar-by-bar price action report by signing up for free at BrooksPriceAction.com. I talk about the detailed Emini price action real-time throughout the day in the BrooksPriceAction.com trading room. We offer a 2 day free trial.
Weekly Reports Archive
You can access all weekly reports on the Market Analysis page.

