Market Overview: EURUSD Forex
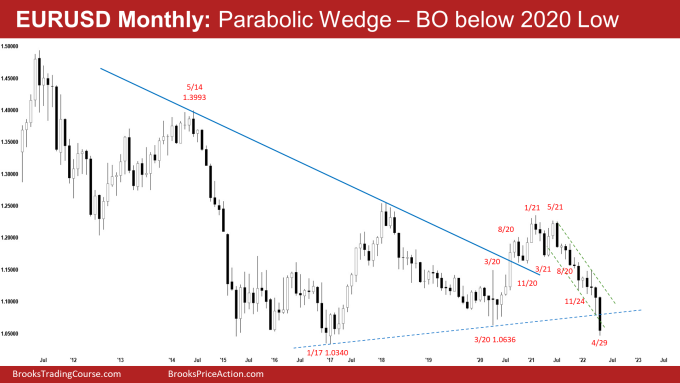
The EURUSD Forex broke below March 2020 low. The next target for the bears is the 7-year trading range low. The sell-off is in a tight channel which means strong bears.
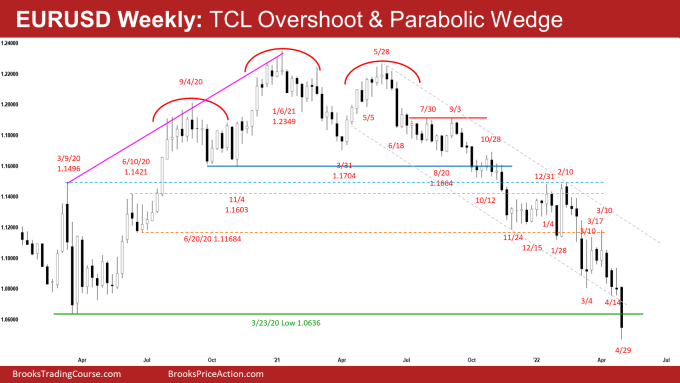
The monthly and weekly candlesticks overshoot the trend channel line this week. There is also a EURUSD Forex parabolic wedge on the chart. While lower price is slightly more likely, traders should be prepared for a 2-legged sideways to up pullback (bounce) which can begin at any moment.
EURUSD Forex market
The Monthly EURUSD Forex chart

- The April Monthly EURUSD candlestick was a big bear bar with a noticeable tail below. It closed below the March 2020 low.
- The sell-off since June 2021 is in a tight bear channel, which means persistent selling.
- The EURUSD overshot the bear trend channel line in April.
- It is also the largest bear bar since the bear leg started in June 2021. The largest bar(s) appearing late in the trend regularly appears near the end of a buy/sell climax.
- When the last bulls have sold (capitulated – selling at any price to get out), there will not be enough sellers to push the market much lower. It may lead to at least a small 2-legged sideways to up pullback (bounce).
- The bears want a continuation lower to test the 7-year trading range low followed by a breakout and a measured move down based on the height of the 7-year trading range.
- The bulls hope that this is simply a sell vacuum test of the March 2020 low or the 2017 low.
- They want a failed breakout from below March 2020 low and a reversal up from a trend channel line overshoot and parabolic wedge (August 20, November 24, April 29).
- Al has said that the market has been in a trading range for seven years. It is now near the bottom of the range. Reversals are more likely than breakouts. Therefore, as strong as the selloff has been, it is still more likely a bear leg in the seven-year trading range than a resumption of the 15-year bear trend.
- The odds of a reversal from the bottom of the trading range around the March 2020 low or around the January 2017 low are slightly higher than a strong breakout below 2017 low and a measured move down.
- Since April was a big bear bar, it is a weak buy signal bar for a strong reversal up. The bulls will need a strong reversal bar or at least a micro double bottom with follow-through buying before they would be willing to buy aggressively.
- The 2017 low is near enough and that makes it a magnet below. The EURUSD may need to test it before we see buyers return.
- For now, odds slightly favor sideways to down to test the 2017 low.
- However, because of the 1) oversold conditions, 2) trend channel line overshoot and 3) parabolic wedge, traders should be prepared for at least a small 2 legged sideways to up pullback (bounce) which can begin at any moment.
The Weekly EURUSD chart

- This week’s candlestick on the weekly EURUSD Forex chart was a big bear bar with a prominent tail below. It closed below the March 2020 low.
- Last week, we said that the EURUSD may continue to see trading range price action for another week or two. If there is a breakout, odds slightly favor a downside breakout.
- Traders will be monitoring whether the bears get a 4th consecutive bear bar and reach the measured move around 1.072 or the bulls manage to create a strong reversal bar instead.
- This week, the bears got a downside breakout and exceeded the 1.072 measured move target.
- The bears have another measured move target based on the height of the 3-week trading range (March 7 to March 31) which will take them to around 1.4268 which is near the 2017 low. It is close enough to be a magnet below.
- The bulls hope that this is simply a sell vacuum test of the March 2020 low or the 7-year trading range low. They see a parabolic wedge (August 20, November 24, April 29) and a trend channel line overshoot.
- Al has said that the market has been in a trading range for seven years. It is now near the bottom of the range. Reversals are more likely than breakouts. Therefore, as strong as the selloff has been, it is still more likely a bear leg in the seven-year trading range than a resumption of the 15-year bear trend.
- If the bears can get another bear close below the March 2020 low, the selloff should continue down to the 2017 low, which is the bottom of the 15-year bear trend. A couple of closes below that low would probably be the start of a measured move down based on the height of the seven-year trading range.
- For now, the odds of a reversal from the bottom of the trading range around the March 2020 low or around the January 2017 low are slightly higher than a strong breakout below the 2017 low and a measured move down.
- Since this week was a big bear bar, it is a weak buy signal bar for a strong reversal up.
- The bulls will need at least a strong reversal bar or a micro double bottom with follow-through buying before they would be willing to buy aggressively.
- Odds slightly favor sideways to down to test the 2017 low magnet below.
- However, because of the 1) oversold conditions, 2) trend channel line overshoot and 3) parabolic wedge, traders should be prepared for a 2-legged pullback (bounce) which can begin at any moment.
Market analysis reports archive
You can access all weekend reports on the Market Analysis page.

