Market Overview: Weekend Market Update
The Emini should test down to 2500 – 2600 in May. There is a wedge top on the daily chart. But there are High 1 bull flag buy signals on both the daily and weekly charts. There will probably be one more brief leg up to the 20 week EMA before the selloff begins.
Crude oil had an extreme sell climax last week. It might have to go sideways for a long time before there is much of a reversal up.
The EURUSD Forex market is near the bottom of a 3 month trading range. It will probably begin to reverse up for 2 – 3 weeks within a couple weeks.
Crude oil futures monthly chart:
Reversal up from extreme sell climax
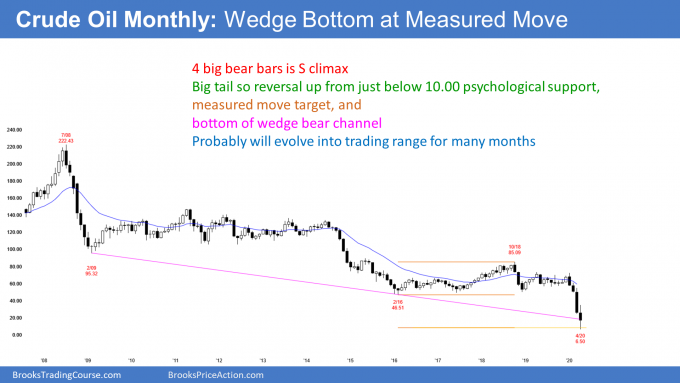
The monthly chart of crude oil has been in a bear trend for 12 years. This year’s selloff is the 3rd leg down from the 2008 high. This month reversed up strongly after breaking below the bear channel.
Furthermore, the low was a measured move down from the height of the 2015 – 2020 trading range. Finally, the low was from single digits. Ten dollars is an important Big Round Number and therefore psychological support.
This week is a reasonable candidate for the end of the current leg down. A bear trend ends when no one is left to sell at the low. The bears see that it is getting too easy to sell at the low. Good fill, bad trade. Too many buyers down there. They conclude that they need to sell higher and therefore stop selling near the low.
Additionally, at the bottom of a sell climax, the bears have huge profits. Since their stop is far above, they become eager to reduce their risk. They look for a sell climax at support and then take profits. That reduces their position size, which means their risk is less.
The bulls see the reversal up and they begin to buy. The result is a sharp short covering rally. For example, the May contract rallied $50 in its final 24 hours. Also, the June contract went up more than 100% in 24 hours this week.
What happens after a sell climax?
When the bears take profits, they want to be confident that the bear trend has not become a bull trend. At a minimum, they want to see at least 2 attempts at a trend reversal up. After those 2 legs up, they will begin to sell again if they think the rally is failing.
That means that the minimum rally will have at least a couple legs up and last at least 10 days. That is about 2 weeks. It could be much more, but usually not much less.
About 20% of the time, when there is a reversal up from a sell climax, the V bottom reversal grows into a bull trend. What usually happens is that the rally has a couple legs up. Traders then look for a resumption of the bear trend. If that 2nd selloff reverses up again, there is a 40% chance of it growing into a bull trend. More often, there are additional legs up and down and the bear trend evolves into a trading range.
Every trading range always has both buy and sell signals. But crude oil is unlikely to fall much below $10. That means there will eventually be a bull trend.
However, the trading range could last many months and possibly years before a significant bull trend begins. If the range is tight, traders call that a “dead money” market. There is little profit potential and many traders will choose to trade other markets.
Traders should expect crude oil to be a trader’s market for a long time. They will buy low, sell high, and take quick profits, betting on a trading range and against a trend.
Crude oil daily chart: Fell below zero this week!
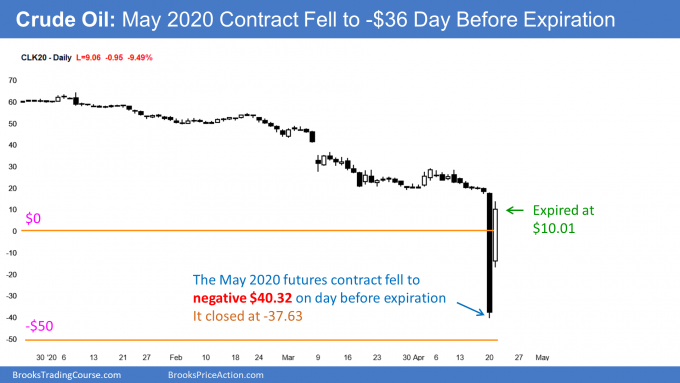
The daily chart of the May futures contract expired on Tuesday at $10.01. What is noteworthy is that it traded down to far below zero on Monday. It closed on Monday at -$37.63 a barrel. That means that at that moment, the oil producers were willing to pay 37.63 to anyone willing to take the oil off their hands. They had determined that it was better financially to pay someone to take the crude oil than it was for them to keep it.
There are many factors involved. An obvious one is that they clearly did not have the ability to store it because all of their storage tanks were full.
Another important factor is that taking crude oil from below the surface of the earth is not the same as getting water from a faucet. You cannot instantly turn it off and then on. If that were the case, they would have done it.
Why don’t the oil producers cut the supply of oil?
There are two primary reasons for the oversupply. One is you. How many miles have you driven over the past couple months? Compare that to last year at this time. Consumption is much less.
The other reason is less certain and it has to do with Saudi Arabia and Russia. The news says they are squabbling over reducing supply. It is being reported that they cannot come to an agreement about cuts that would be big enough to raise prices. Okay, fair enough.
Follow the money
Then there is the uncertain part of it. That has to do with intent. It would benefit both countries if the US crude oil production was severely curtailed. One way that could happen is if lots of US oil producers ceased to exist. That could happen if oil prices stay this low for several months.
Why wouldn’t the Saudi and Russian oil companies go bankrupt as well? Because they are effectively owned by their governments and those governments will not let that happen.
Saudi Arabia and Russia could quickly make the price go up by greatly cutting supply. Why are they not doing that when the low prices are also hurting their economies? It must be that they see the low oil prices as benefiting them in the long run.
This is an old fashioned price war. Those wars are fought to drive a competitor out of business. Short-term pain for long-term gain. Once the competitor is gone, you get his market share and you are free to greatly raise the price without the fear of competition.
Saudi Arabia denies that this is their motive. Trump is best friends with Putin, and it is unimaginable that a best friend would ever be so nefarious. But if you follow the money, the path leads to this conclusion, despite the denials.
Where are Washington and the media?
What is surprising to me is that I haven’t heard anything bold coming out of Washington about fighting back. A price war is an actual form of war, and it therefore requires a strong defense. For example, the Fed says it is willing to print infinite dollars to save the economy. Why hasn’t the Secretary of Energy said that the Army Corps of Engineers will build infinite oil storage tanks to fight back?
I really don’t understand why I haven’t heard any bold statement from Washington to the effect that the Saudis and Russians have crossed a line and that our government would do whatever is necessary to defend our interests. In part, it is because the pandemic is consuming everyone’s attention. But what is happening to oil is very important, and our government is failing to address it.
There has been some talk about paying US oil producers to stop producing, like grain incentives, but the idea does not appear to be gaining traction.
The press is ignoring the problem. I assume it is a combination of the pandemic and schadenfreude. Energy has done many things over the years that have angered environmentalists and the media. Maybe the media is quietly enjoying hearing the powerful voice of the fossil fuel industry become a lot quieter.
EURUSD weekly Forex chart:
Breaking below Low 2 bear flag
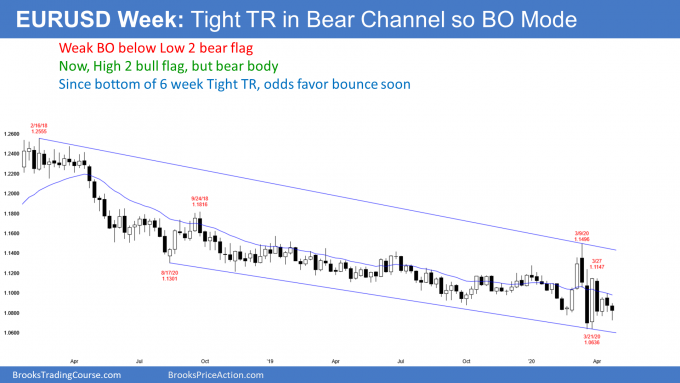
The EURUSD weekly Forex chart has been in a bear channel for 2 years. Channels often spend a lot of time in trading ranges. The EURUSD had been sideways for 8 months. It formed an expanding triangle into March and a contracting triangle over the past 7 weeks. The triangle is easier to see on the daily chart.
This is a diamond pattern. Diamond patterns and triangles are simply types of trading ranges. Every trading range is a Breakout Mode pattern. That means that the probability of a successful breakout is about the same for the bulls and for the bears. Furthermore, there is a 50% chance that the 1st breakout up or down will fail.
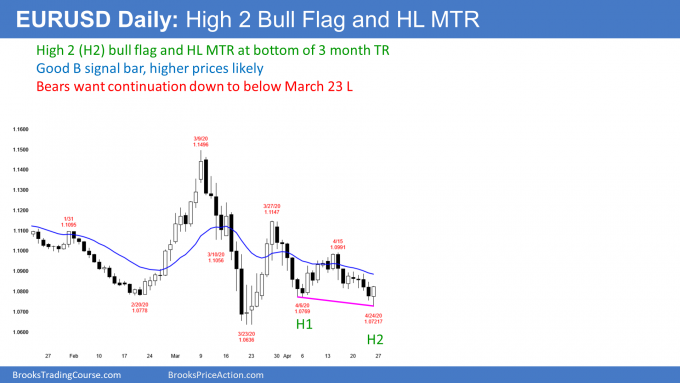
On the daily chart, the past 2 weeks have broken below the triangle. This corresponds to the breakout below the Low 2 bear flag on the weekly chart.
However, the breakout has been weak. Friday was a bull day and therefore a buy signal bar. The bulls see Friday as forming a higher low major trend reversal. In addition, it is the end of 2 legs down from the March 27 rally. There, it is also a buy signal bar for a big High 2 bull flag.
But the 2 week selloff has been in a tight bear channel. This is therefore a weaker buy setup. Most bulls will want at least a micro double bottom or a surprisingly big bull bar before concluding that a 2 – 3 week leg up is beginning. However, the odds favor higher prices beginning within 2 weeks.
Small sideways bar with prominent tails over the past 2 weeks is a sign of complacency. It reduces the chance of a big move up or down next week.
Will the bears get a test of par (1.0)?
The bears want the breakout to continue down below the March low. If the bears get a couple consecutive closes below that low, traders will look for a break below the January 2017 low of 1.0340 and then a test of par (1.0).
But it is important to remember that there have been many breakouts and strong legs up and down for 2 years. Every one of them led to a reversal instead of a trend.
Traders therefore believe that this week’s breakout will not get far. They expect a reversal up from above the March 1.0636 low. And even if the selloff continues below that low, they know that there will probably be a reversal up.
Since the March low is nearby and a higher low is likely, traders expect a reversal up within the next few weeks. Less likely, there will be a successful break below the March low and a trend down to par.
Covid 19 Update
First of all, on February 29, 2020, when there were only 70 confirmed cases of coronavirus infection in the US, I wrote that possibly 3 billion people could get infected and 50 million people could die. In my chat room that week, I said that it was reasonable to consider the possibility of a million Americans dying and 50% of the country getting infected.
If you have been following the news, you might have heard Dr. Fauci a couple weeks ago say that maybe only 60,000 Americans would die. He and Dr. Birx said that the worst case is 100,000 to 200,000 deaths.
Who’s right, Dr. Brooks or Dr. Fauci (yes, I really am a physician)? They are political appointees and that constrains them when they speak. They will not lie, but they will also not freely say everything they believe if they want to keep their jobs.
I agree that he and Dr. Birx are the experts, but I do not see how we avoid 30 – 50% of the country getting infected. That is 100 to 160 million people.
Maybe only 20% will have symptoms, but 1/2 to 1% of the infected people will die. If 1/2% of 160 million infected Americans die, that is about 800,000 people.
If only 30% of the country gets infected, a 1/2% death rate results in 500,000 deaths. That is more than the total American deaths in World War II, the Korean War, the Vietnam War, The Iraq War, and the Afghan War combined. I do not see how we avoid that. I think 200,000 American deaths is the best case, not the worst case.
A vaccine will not suddenly stop the pandemic
My prediction is far worse than the worst case of Dr. Fauci and Dr. Birx. I hope that Dr. Brooks is wrong and that Drs. Fauci and Birx are right, but I do not see how only 100,000 Americans will die.
Even if there is a vaccine in 6 months, the anti-social distancing crowd will guarantee that 30 – 50% of the country gets infected. I think we will be lucky if Dr. Fauci and Dr. Birx’s worst case of 200,000 deaths is the final total.
It is important to note that I am holding this view even with a vaccine coming early next year. The vaccine is not a light switch that instantly turns the pandemic off. It will roll on for many months after the start of vaccinations. Millions more Americans will still get infected after the vaccinations begin.
The importance of multiple studies confirming each other
Last week I wrote that I needed to see other studies confirming the benefit of Remdesivir in the treatment of severe Covid 19 infections. A study came out this week that found no benefit.
I mentioned that I was a medical scientist many decades ago and I never believe anything until it has been confirmed by at least 3 or 4 major medical centers. Also, I really need to see a double blind study where neither the patient nor the doctor knows if the patient is receiving the medicine or the placebo.
What’s a double blind study?
A double blind study is one where both the patient and the doctor are “blind.” The patient is treated with either a placebo or the medicine, but neither the doctor nor the patient knows which is in the medicine bottle.
Here is a simplistic way to look at it. There is a box of pill bottles and each bottle has a different number on it. The doctor randomly grabs a bottle of pills and gives it to the patient. He then plugs the bottle’s number and the patient’s name into a computer.
When the date arrives for the end of the study, the doctors decide if each patient is better or not. They enter that into the computer. After the doctors vote on every patient, the computer program allows everyone to see if the patients who got the medicine did better than those who got the placebo. They compare the 2 treatments using every at every imaginable factor. That includes every symptom, sign, side effect, and measure of success.
It’s all about the math
A medical statistician applies some formulas to the data to determine how significant the result is. If the math shows that there is a 95% chance or better that the medicine is better than the placebo, the scientists conclude that the medicine is effective and that the result is statistically “significant.”
Again, they look at every way to measure what “effective” is. The headline ways are what you hear about. Those are things like the percent who died in each group or how long it took to get better.
The treated patients can do much better than the untreated patients, or just a tiny bit better. For example, assume that 1000 patients took the medicine and all were 100% cured the next day. Also assume that only 1% of placebo patients were better on the 2nd day and the average placebo patient got better in 10 days. The drug is clearly effective.
But, for a different drug, assume that the average patient got better in 9 days and the average placebo patient took 10 days. There still might be 95% certainty that the medicine was effective, but it was not much better than the placebo. Most doctors would not prescribe the drug because every drug has side effects. Those could erase the 1 day benefit.
A well-constructed, big, double blind, multi-medical center test is considered the gold standard of medical testing. It is the best way to eliminate even minor biases, and of course, fraud. There are still ways to mess it up. But if it is done on a lot of patients with many doctors at many medical centers participating in the study, it is very reliable.
Also, remember the early studies that showed that anti-malarial drugs were helpful? I always cringe when I see non-scientists hype stuff like that. It is ignorant. It does a disservice because people die from following the stupid recommendations. Well, new studies have shown that they not only did not help, they increase the risk of death.
To paraphrase James Carville, “It’s the vaccine, stupid”
All of this stuff about treatment is just entertainment to distract us from what everyone knows is true. There is no return to anything close to normal until there is a safe and effective vaccine.
And unless it is perfect, life for us might be different forever, at least to some extent. The more our behavior remains different, the more weight there will be on the economy.
Since the vaccines (there will be many options) will not be perfect, many people will curtail some activities forever. If enough reduce their spending, there will be a permanent reduction in the world’s GDP.
American hubris
I think the press is missing something. All I hear about is American scientists working on vaccines. There are already many vaccines currently being tested in the US. But the FDA will not allow them to be used on the public until 3 phases of testing are complete. That will be in early 2021.
I have met many very smart doctors and medical scientists from around the world and they are just as good as our best. They are also working on vaccines. Many are in countries that do not have exactly the same lengthy 3 phase testing that we have in the US. I bet one or more effective vaccines will be approved overseas within 4 – 6 months.
If the pandemic continues to be horrific, the FDA might be forced to allow these vaccines to be used in the US before the regular 3 phase testing is complete. If not, lots of Americans will start flying again… to the countries that will give them the vaccine!
A vaccine has to be both safe and effective
I said that the vaccine has to be safe and effective. If the vaccine has a high incidence of serious side effects, most people will not get it. Life will remain as it is now.
Also, the vaccine has to be effective. The public has the erroneous opinion that effective vaccines prevent close to 100% of infections. That is nonsense.
In a good year, 30% of people receiving a flu shot can still get the flu. When 30% can get infected, that is considered a great flu vaccine. In a bad year, 70% can still get infected after vaccination. If the coronavirus vaccine is only 50% effective and if wears off in 3 months, then we still have a major coronavirus problem.
All viruses mutate. There is a reasonable chance that mutations of the current coronavirus (the official name is SARS-CoV-2) could be with us forever. If so, we might end up getting a combined flu and coronavirus vaccine every year.
Christopher Marlowe and the economy
If I am right, then the pandemic is going to last much longer and affect far more people than what the news is reporting. Yes, the stock market is rallying and there are many hopeful stories about several states getting back to work. But, is this sustainable? Not if my thoughts about the pandemic are correct.
Why are states talking about lifting social distancing restrictions? Is Georgia’s governor saying that the pandemic is just about over so let’s get back to normal? No! He is arguing that it is better to have 1% of all Georgians die than to continue the anxiety and economic damage that the shutdown in causing.
In the short-run, it is good for the economy to have everyone back at work. But over the course of the next year, it will result in 100 million Americans getting infected and 500,000 to 1 million dying. That is a Faustian bargain, and it is why the stock market will have a difficult time making a new high this year.
Monthly S&P500 Emini futures chart:
Big bull inside bar after sell climax
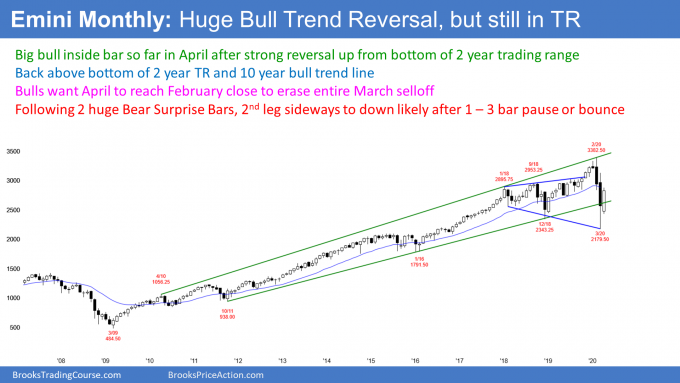
The monthly S&P500 Emini futures chart reversed up strongly in late March. That put a big tail on the bottom of the March candlestick.
The reversal has continued through April. April so far is a big bull bar closing near its high. The bulls want April to close above 2939.75. That is the February close. If April closes above that price, the bulls will have totally reversed the March collapse. That would be a sign of strong bulls and increase the chance of sideways to up prices over the next couple months.
However, the die is cast. Those 2 huge bear bars in February and March were a major surprise. Because they are so dramatic, there is a 70% chance of a 2nd leg sideways to down at some point this year. There is only a 30% chance that the bull trend will continue straight up to a new high.
High 1 bull flag
This month is an inside bar in a 10 year bull trend. It is also a bull bar. April is therefore a High 1 bull flag buy signal bar for May. If April closes on its high, May will probably trade above the April high. That would trigger the monthly buy signal.
But those 2 huge bear bars make the context bad for the bulls. April is probably only a minor buy signal. That means if May triggers the buy by going above the April high, the rally will likely only last a bar (month) or two.
The odds are against a new high at least until after a 2nd leg sideways to down. Consequently, although April is a buy signal bar, there are probably more sellers than buyers somewhere above its high and below the February high.
Weekly S&P500 Emini futures chart:
Emini High 1 bull flag in April buy climax
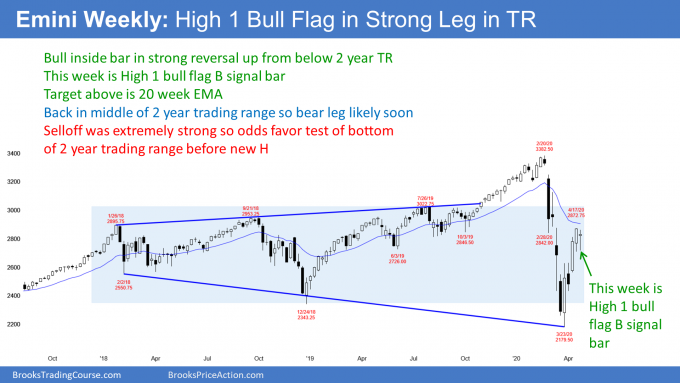
The weekly S&P500 Emini futures chart has rallied for 5 weeks from a V bottom. Only 20% of V bottoms grow into bull trends. As strong as this rally has been, it is still likely to be a bull leg in a trading range.
That means that there will be a bear leg. The rally retraced more than 50% of the 2 month selloff. It is also near the resistance of the 20 week EMA.
Also, 5 months without a pullback is getting excessive for a leg in a trading range. Consequently, traders should expect a 2 – 3 week pullback to begin within a few weeks.
Strong rally, but pullback soon
This week was the 5th bar in the micro channel. Traders have been so eager to buy that they have been buying above the low of the prior week. They will be very happy to buy below the low of the prior week when they finally have the opportunity. Therefore, there are probably buyers below this week’s low.
This week was an inside bar in a bull trend. It is therefore a High 1 bull flag buy signal bar for next week. Also, there is room to the magnet of the 20 week EMA just above. This makes it slightly more likely than not that next week will go above this week’s high. That would trigger the buy signal.
But this week was only a doji bar. That is a weak buy signal bar. Also, the 5 bar bull micro channel is unsustainable and therefore climactic. Finally, the buy signal is coming from just below the resistance of the 20 week EMA. Therefore, traders should expect more sellers than buyers above this week’s high. Those sellers will be at and just above the 20 week EMA.
If next week goes above this week’s high, which is likely, the breakout will probably only last a week or two. Traders should then expect a 2 – 3 week reversal down. A reasonable target would be about a 50% correction. That is around 2500 – 2600.
The rally has been strong enough to expect at least a small 2nd leg up. Therefore the bulls will probably buy again below 2600.
V bottom but probably just a leg in a trading range
It is important to remember that a rally from a V bottom only has a 20% chance of growing into a bull trend. Therefore, there should be a test down soon. But the rally has been strong enough to make a 2nd leg up likely.
These repeated legs up and down are the early signs of a trading range. This developing range will probably be between 2500 and 3000. It is within the 2 1/2 year trading range between 2200 and 3400.
The January 2018 rally was the most extreme buy climax in history on the daily, weekly, and monthly charts. Traders should expect this 2 1/2 year trading range to continue for the decade. There will probably be at least one new high and low. Traders should expect the 10 year range to expand and be between 1800 and 3600.
Daily S&P500 Emini futures chart:
Weak wedge top so might get one more leg up
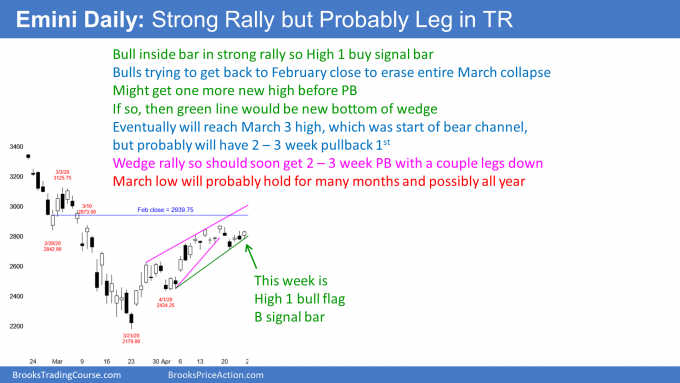
The daily S&P500 Emini futures chart formed a bull inside bar in a 5 week bull trend on Friday. That is a High 1 bull flag buy signal bar for today. Remember, on the weekly chart, last week was also an inside bar and a High 1 bull flag buy signal bar.
There are already 3 legs up in the 5 week rally on the daily chart. That means there is a wedge, which is a type of buy climax. Buy climaxes tend to attract profit takers and bears willing to short. But if there is one more leg up and then a reversal, the wedge would be more convincing. That would attract more sellers.
The wedge top on the daily chart has a bad shape. As a result, many bears are hesitant to sell and many bulls are continuing to buy. They think the rally will continue at least a little higher.
In addition to the bad shape of the wedge on the daily chart, the weekly chart has a buy signal bar this week. Also, the 20 week EMA is a magnet just above. These factors make it slightly more likely that there will be one more leg up on the daily chart before a 2 – 3 week selloff to below 2600 begins.
V bottom but probable leg in a trading range
As I discussed in the section on the weekly chart, the Emini is reversing up in a V bottom. Only 20% of V bottoms grow into bull trends. Traders know that the rally is likely to end soon. But until there is a clear top at resistance, the bulls will continue to buy.
This reversal has gone a long way and lasted a long time. Since traders believe it is not the start of a trend, they expect a bear leg to begin soon. There is almost a 50% chance that it is already underway.
Because the rally has been so strong, there will be many bulls who will be eager to buy the 1st pullback. Consequently, it will probably only last 2 – 3 weeks. It might retrace about half of the rally.
The rally is a Spike and Channel Bull Trend. Traders expect the eventual reversal to test the start of the channel. That is the April 1 higher low. But that is far below and the rally has been extremely strong. The 1st reversal down will probably not fall that far.
What are alternative targets? A common one is a test of the breakout point. That is the March 31 high of 2629.50. Another is a 50% correction. There is also the gap above the early April 3 day island bottom. These are all in the 2500 – 2600 area and that makes a pullback to that level likely.
What happens next week?
If the selloff to below 2600 has already begun, the bears should be able to create at least a couple big bear bars. It is more likely that the weekly chart will control the Emini over the next 2 weeks. Traders should expect one more push up to the weekly EMA next week. Since the weekly buy signal bar is weak and the rally is extreme, traders should then look for a 2 – 3 week correction to below 2600 to begin a week or two later.
Trading Room
Traders can see the end of the day bar-by-bar price action report by signing up for free at BrooksPriceAction.com. I talk about the detailed Emini price action real-time throughout the day in the BrooksPriceAction.com trading room. We offer a 2 day free trial.
Charts use Pacific Standard Time
When I mention time, it is USA Pacific Standard Time (the Emini day session opens at 6:30 am PST, and closes at 1:15 pm PST). You can read background information on the intraday market reports on the Market Update page.

