Monthly S&P500 Emini futures candlestick chart: Overbought, but no sign of a top
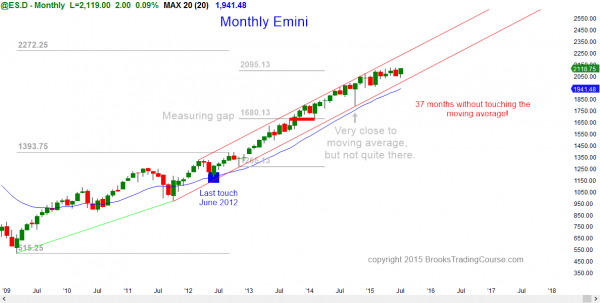
The monthly S&P500 Emini futures candlestick chart is still in a tight trading range. It has not touched the moving average for 37 months, and this type of price action is a form of a buy climax.
The monthly S&P500 Emini futures candlestick chart has not touched its moving average in 37 months. This has happened only twice before in the past 50 years. In 1987, it held above it for 38 months (1 month more than now), and then crashed. In 1998, it lasted for 44 months and then fell 22%. Since the current instance is occurring late in a bull trend, the odds are that this will not continue for 44 months, as it did in 1998. It is more likely going to fall sooner, and I think that there is an 80% chance that it will get to the monthly moving average this year. If it waits until December, that would be 42 months, which would be very close to what it did in 1998.
It theoretically never has to touch the moving average, but it always does, and it will soon this time as well. However, there is no sign of a top, and it is possible that it stays above it for more than any other time in the past 50 years. However, extremely rare things happen only extremely rarely, and more often they do not happen. The odds of it happening now are therefore small. There is no sign of a top, but the reversal down can happen with just 1 or 2 bars on the monthly chart. Once it does reach the moving average, it will probably create a bull flag on the monthly chart, even though the selling will result in the daily chart entering at least a brief bear trend.
Weekly S&P500 Emini futures candlestick chart: Reversal up from its moving average, but still in a potential final bull flag.
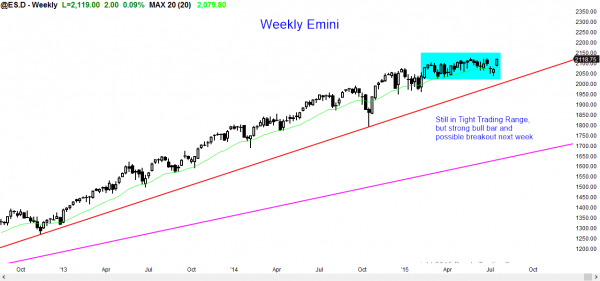
The weekly S&P500 Emini futures candlestick chart had a strong bull trend bar this week, but it failed to break out of its tight trading range.
The weekly S&P500 Emini futures candlestick chart reversed up from the weekly moving average and is breaking above an 8 week bear channel (High 2 bull flag). That bull flag is still within the 6 month tight trading range, and until there is a breakout, there is no breakout, and the odds favor more bars being added to the tight trading range, rather than a breakout.
There should be a breakout soon because the monthly chart is so overbought. If there is a bull breakout, it will probably fail within about 5 bars, which is 5 weeks since this is a weekly chart. Less likely, the breakout will be a measuring gap and the start of a new leg up, rather than an exhaustion gap and the end of the bull trend.
Daily S&P500 Emini futures candlestick chart: Traders learning how to trade the markets can see a strong rally that is testing the top of the 6 month trading range.
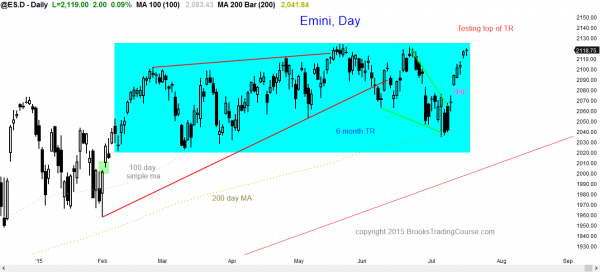
The daily S&P500 Emini futures candlestick chart reversed up strongly from its 200 day moving average and is now testing the top of the 6 month trading range.
The daily S&P500 Emini futures candlestick chart reversed up strongly from its 200 day moving average, but it is still in the 6 month tight trading range. The bears want a double top lower high major trend reversal with the June high. They then want a reversal down and a bear breakout below the 6 month trading range.
The bulls want a bull breakout and a measured move up. Traders should be ready to buy the breakout for a leg up on the daily chart. Bears will probably need a 2nd leg down, maybe in the form of a micro double top, if they are going to be successful in preventing the bull breakout. This week’s rally was strong enough so that the odds favor buyers below on the 1st reversal down. This means that most bears will not short until there is a 2nd sell signal, like a micro double top on the daily chart.
Next week will probably either breakout to a new all-time high (it might even gap up to one on Monday), or reverse down from a double top with the June high. In either case, day traders should get a big swing one way or the other, which will probably create high probability trading and good setups and trading for beginners.
Traders can see the end of the day bar-by-bar price action report by signing up for free at BrooksPriceAction.com. I talk about the detailed Emini price action real-time throughout the day in the BrooksPriceAction.com trading room, and a 2 day free trial is available.
When I mention time, it is USA Pacific Standard Time (the Emini day session opens at 6:30 am PST, and closes at 1:15 pm PST). You can read background information on the intraday market reports on the Intraday Market Update page.


