Monthly S&P500 Emini futures candlestick chart: Candlestick pattern will be clearer next week
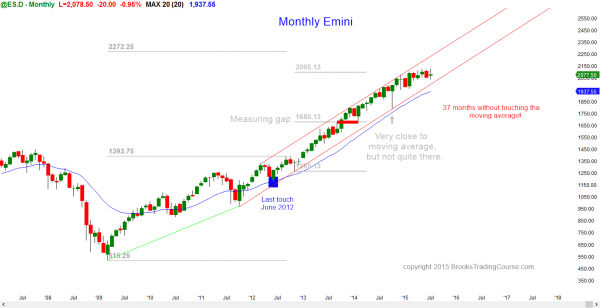
The monthly S&P500 Emini futures candlestick chart is in the middle of its 5 month trading range, and the candlestick pattern today is a doji. The chart is in breakout mode.
The monthly S&P500 Emini futures candlestick chart has been above its moving average for 37 months, which has happened only twice before in the past 50 years, Since the moving average is about 10% down from the high, there is about an 80% chance of at least a 10% pullback this year. The current candlestick pattern in a doji, but the month has one week left and it can be a strong bull or bear bar once it closes next Friday. The context is a tight trading range, which is a breakout mode candlestick pattern. This type of price action is usually followed by a breakout. Since the monthly chart is so overbought, a bull breakout will probably fail within a few months and then reverse down.
The bear reversal will probably just become a pullback on the monthly chart, which means that there will probably be bulls willing to buy once it falls to the moving average. However, the selloff will be enough to create at least a brief bear trend on the daily chart.
Weekly S&P500 Emini futures candlestick chart: Another reversal in a 6 month tight trading range
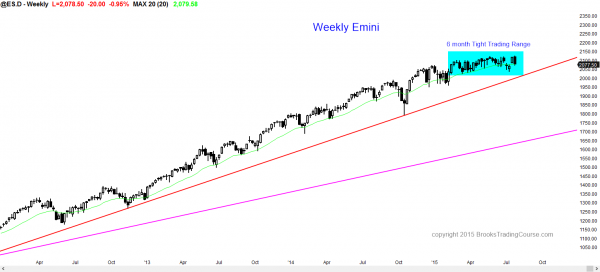
The weekly S&P500 Emini futures candlestick chart reversed down from a new all-time high, but the price action is still within a 6 month trading range.
The weekly S&P500 Emini futures candlestick chart gapped up last week, creating an island bottom, but this week’s reversal down closed the gap up, and the tight trading range is still in effect. Until there is a strong breakout with good follow-through, there is no breakout. Even though this week’s price action was bearish, the selloff is still simply a pullback to the weekly moving average. This week was likely to disappoint last week’s bulls because that is one of the hallmark’s of a trading range. Strong bars are more likely to reverse than begin a breakout.
Daily S&P500 Emini futures candlestick chart: Strong reversal down from a weak breakout to a new all-time high
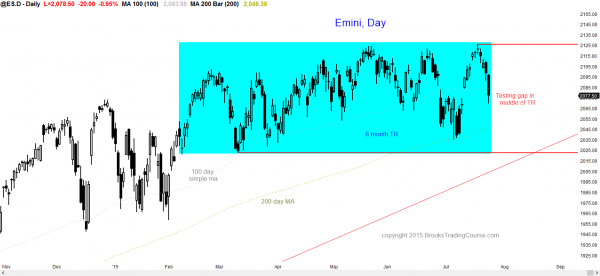
The daily S&P500 Emini futures candlestick chart sold off strongly from a new all-time high and it is now testing the middle off the 6 month trading range.
The daily S&P500 Emini futures candlestick chart reversed down strongly from a new all-time high. I mentioned that there might be a pullback to test the gap and the top of the trading range from 2 week’s ago, but this week’s selloff was surprisingly strong. Does that make it likely to be the start of the bear breakout? No more so than last week’s rally was likely to be the start of a successful bull breakout. When the price action is within a trading range, the probability of the direction of a successful breakout is about equal for the bulls and bears. The bears have a slight advantage because of the current buy climax on the monthly chart, but until there is a strong breakout, the probability is not much more than 50% for either the bulls or the bears.
This week’s selloff was climactic and it will probably be followed by at least a couple of day’s up next week. If instead next week continues to sell off with big bear trend bars, the odds of a bear breakout will go up. If the bears succeed in getting a strong breakout below the trading range, traders will expect at least 2 legs and a measured move down. Since the trading range is about 100 points tall, the selloff will probably be at least 100 points, and test the monthly moving average. The swings have been stronger and the reversals bigger over the past month. This increases the chances that there will be a breakout soon.
Traders can see the end of the day bar-by-bar price action report by signing up for free at BrooksPriceAction.com. I talk about the detailed Emini price action real-time throughout the day in the BrooksPriceAction.com trading room, and a 2 day free trial is available.
When I mention time, it is USA Pacific Standard Time (the Emini day session opens at 6:30 am PST, and closes at 1:15 pm PST). You can read background information on the intraday market reports on the Intraday Market Update page.


