Monthly S&P500 Emini futures candlestick chart: Triggered the sell signal, but needs strong entry bar
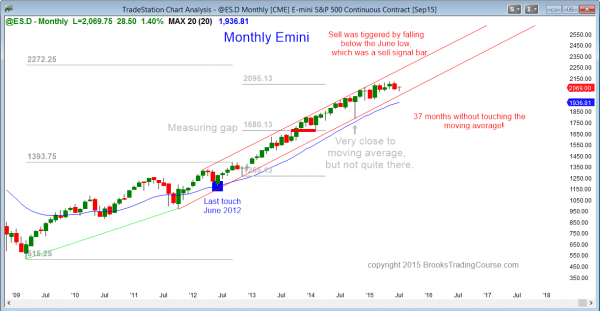
The monthly S&P500 Emini futures candlestick chart triggered a sell signal by falling below last month’s low, but the bears need a strong entry bar. There is still a long time before this month’s candlestick closes, and it could even be a buy signal when it does.
The monthly S&P500 Emini futures candlestick chart is still in a strong bull trend, but it is extremely overbought. The Crash in 1987 occurred following 38 months above the monthly moving average. July is now the 37th month above the average. While I believe that it will not crash, I think that there is an 80% chance that it will pull back to below the average at some point this year, and the average is about 10% down from the high. Since the Emini is so extremely overbought, there is about a 50% chance that the pullback will test the October low, which would create about a 20% correction. The bears need a strong bear breakout, which has not yet happened.
While it might come next week because of news from Greece, it is equally likely that it will rally on the news. However, any new high will probably fail to get very far until after there is a pullback to the moving average.
Weekly S&P500 Emini futures candlestick chart: Tight Trading Range
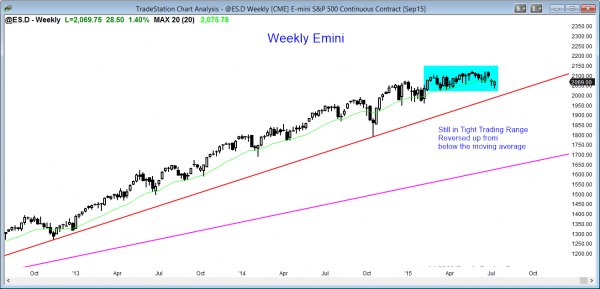
The weekly S&P500 Emini futures candlestick chart is still in its tight trading range. Although last week and this week both closed near their highs, this is the first time in 9 months when there have been consecutive closes below the moving average.
The weekly S&P500 Emini futures candlestick pattern is a 7 month tight trading range. Until there is a breakout, there is no breakout. If there is a bull breakout, it will probably be limited to about 5 bars (weeks) or less because of how overbought the monthly chart is.
Daily S&P500 Emini futures candlestick chart: Emini and Stock market trading at support
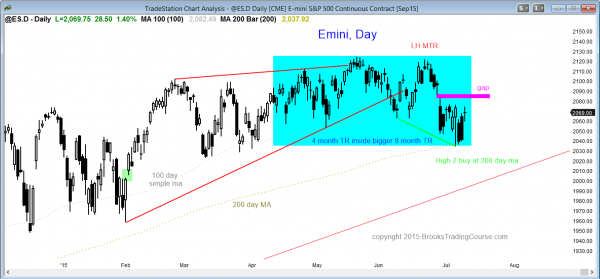
The daily S&P500 Emini futures candlestick chart is still below its gap down, but it is finding support at the 200 day moving average. It is in breakout mode.
The daily S&P500 Emini futures candlestick chart is in the early stages of a bear trend. When the Emini is in a trading range that lasts a long time, like this one has, it is also in a bull trend and in a bear trend. If the Emini rallies to a new high, traders will say that this trading range formed to relieve the overbought condition, but that the trading range was just part of the bull trend. They will point to the reversal up at the 200 day moving average as a sign of strong bulls buying at long-term support.
If the Emini has a bear breakout and enters a clear bear trend, traders will say that the bear began at the market top, which was almost 2 months ago. They will describe the trading since then as the early stages of the bear trend.
As long as the Emini remains below the gap down, the bears probably have a slightly higher probability than the bulls. If the Emini gets back above the gap, the odds will favor at least one more new high. Until there is a strong breakout with follow-through, the trading range will continue. Because the monthly chart is so overbought, a downside breakout will probably come this year, even if there is a bull breakout to a new all-time high first. Price action traders will continue to buy low and sell high until the breakout comes.
Traders can see the end of the day bar-by-bar price action report by signing up for free at BrooksPriceAction.com. I talk about the detailed Emini price action real-time throughout the day in the BrooksPriceAction.com trading room, and a 2 day free trial is available.
When I mention time, it is USA Pacific Standard Time (the Emini day session opens at 6:30 am PST, and closes at 1:15 pm PST). You can read background information on the intraday market reports on the Intraday Market Update page.


