Monthly S&P500 Emini futures candlestick chart: Overbought and in breakout mode
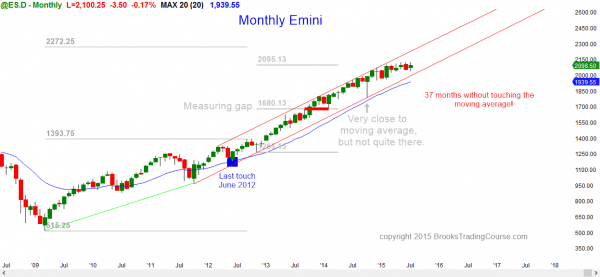
The monthly S&P500 Emini futures candlestick chart remains in its 7 month trading range and in breakout mode.
The monthly S&P500 Emini futures candlestick chart next week will be in its 38th consecutive month without touching the moving average. The S&P cash index has only gone longer one time in 50 years, and that began with the incredible rally that after the 1994 election when republicans took over the House. The rally continued for 44 months and then corrected 22%.
In 1987, the stock market crash began after 38 months above the monthly moving average. While a crash is not likely now, 1987 was another example of a 20% or more drop after staying above the moving average for a very long time. If the Emini does not touch its monthly moving average this year, that would be 42 months and almost as long as the 1998 rally. That rally was at the start of a trend and therefore was more likely to last a long time. The Emini now is late in a rally, which reduces the probability of the trend being the most overbought in over 50 years.
The odds remain about 80% that there will be a touch of the moving average this year, which would require at least a 10% correction. Because the Emini is so historically overbought, the correction might be deeper, and there is probably a 50% chance that it will fall below the October low. This would be a 20% correction.
There is no sign of a top yet, and there is a 50% chance that there will be a bull breakout first. It could rally for a measured move up, which would be about 80 points above the current all-time high. If the bulls do get their breakout, the 7 month trading range will then probably become the final bull flag before the reversal down to the monthly moving average.
Weekly S&P500 Emini futures candlestick chart: Price action pattern is still a tight trading range
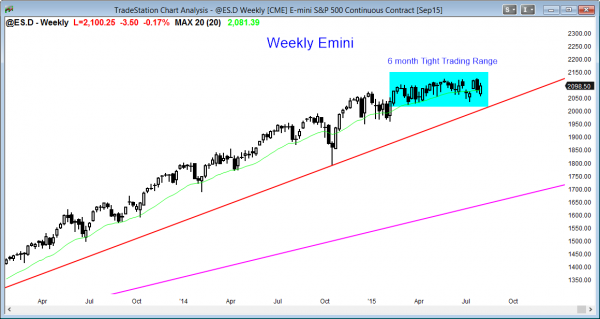
The weekly S&P500 Emini futures candlestick chart has been in a very tight trading range for 7 months with no indication of the direction of the eventual breakout.
The weekly S&P500 Emini futures candlestick chart is in a very tight trading range with no sign of an impending breakout. The breakout up or down will probably go for a measured move. A bull breakout will probably last 5 weeks or less, and then reverse down. Failed breakouts usually fail within about 5 bars.
Daily S&P500 Emini futures candlestick chart: Price action trading strategy before a breakout
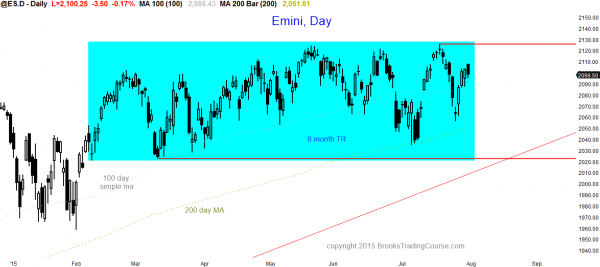
The daily S&P500 Emini futures candlestick chart has had several unusually big swings up and down over the past several weeks, which often happens before a breakout, but there is no breakout yet.
The daily S&P500 Emini futures candlestick chart has had unusually big swings with no pullbacks over the past few weeks. An increase in volatility like this often happens just before a breakout so this might be a sign that the Emini will break out in August. However, until there is a breakout, there is no breakout, and every one of these strong rallies and selloffs is likely to fail. One ultimately will succeed, but it is impossible to know in advance which will be the one that leads to a trend. Trading range traders have correctly been betting that every breakout attempt will fail. They have been buying low, selling high, and scalping (Fast Money trading).
Someone learning how to become a day trader should not be in denial when the breakout comes. It will be in the form of many consecutive trend days. While within the trading range, traders bet that strong legs up and down will exhaust themselves within a few days. When the Emini changes to trend mode, the swing will continue for many days after beginning traders think it should have at least pulled back. Don’t be in denial. Trade the price action in front of you, not the price action that you think is more logical, but not yet present.
Traders can see the end of the day bar-by-bar price action report by signing up for free at BrooksPriceAction.com. I talk about the detailed Emini price action real-time throughout the day in the BrooksPriceAction.com trading room, and a 2 day free trial is available.
When I mention time, it is USA Pacific Standard Time (the Emini day session opens at 6:30 am PST, and closes at 1:15 pm PST). You can read background information on the intraday market reports on the Intraday Market Update page.


