Monthly S&P500 Emini futures candlestick chart: Testing top of trading range
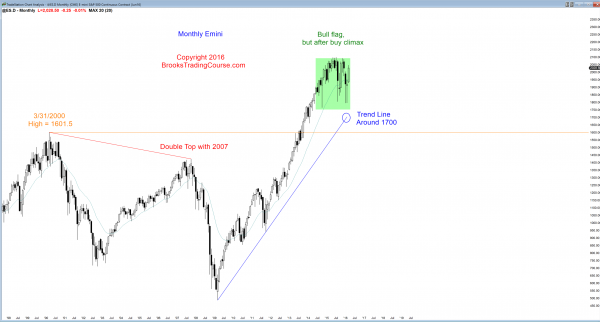
The monthly S&P500 Emini futures candlestick chart has another week before this month closes, and the month so far is a strong bull trend bar.
The monthly S&P500 Emini futures candlestick chart has a week to go before the candlestick closes. Although the candlestick is a big bull trend bar, the market often has a pullback just before a bar closes. This puts a tail on the top of the bar and it serves as a reminder that the rally might not be as strong as it has been for most of the month. The rally is still within a 2 year bull flag, and has yet to break out.
The end of every quarter tends to be bullish. Funds make sure that the quarterly report shows that they hold the strongest stocks, and the fund managers tend to buy the ones that they do not currently hold. Also, the last 2 weeks of March are usually up, and March and April are the strongest consecutive months of the year. You often hear the adage, “Sell in May and go away.” This is consistent with profit taking after a bullish 2 months. Traders should never place trades based on calendar tendencies. It is a losing strategy. However, this seasonality works against much selling over the next week.
Weekly S&P500 Emini futures candlestick chart: 1st pullback after 6 weeks up
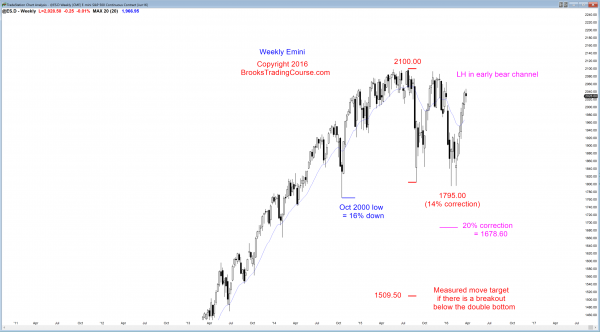
The weekly S&P500 Emini futures candlestick chart had its 1st bear bar in 7 weeks. The rally is strong enough so that the pullback will probably be bought.
The weekly S&P500 Emini futures candlestick chart had 6 consecutive bull trend bars, which is climactic and is usually followed by a trading range for the next month or two. While the Emini could easily go higher, even if next week were to trade below this week’s low, the odds are that the buy climax will prevent many bulls from buying until they see more of a pullback. Traders know that climaxes , especially near the top of a trading range, are more likely to lead to a small trading range than to a bull breakout.
The 6 consecutive strong bull bars is climactic. It is also a sign that the bulls are eager to buy. This tends to limit the downside for at least several weeks. There will probably be enough buyers below so that the best the bears can hope to see over the next few weeks is a trading range.
I mentioned 2 weeks ago that there is a thin area on the weekly chart, and it will probably get filled in over the next couple of months. Even though this rally is back up into the 2 earlier trading ranges, the odds still favor a trading range within the thin area. That trading range will probably last at least 5 – 10 bars. With the current rally as strong as it is, it might take more than a month before the Emini can begin filling in that thin area below.
Will this rally lead to a new all-time high before breaking below the low of the range? Because of the monthly buy climax and the lower highs and lows for the past 9 months, the odds still favor a bear breakout. With the strength of this rally and the distance to the bottom of the range, the odds are barely better than 50-50 for the bears.
Daily S&P500 Emini futures candlestick chart: Learn how to trade a channel bear breakout
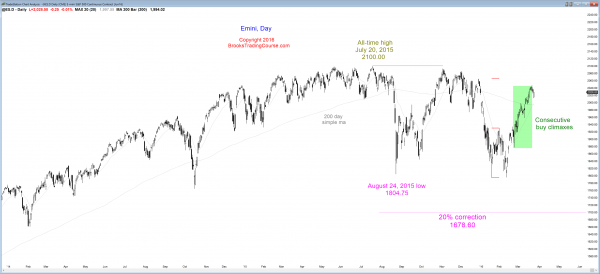
The daily S&P500 Emini futures candlestick chart broke below its tight bull channel, and a trading range is now likely.
The daily S&P500 Emini futures candlestick chart broke below a 7 week tight bull channel. Bulls usually buy the first bear breakout below a tight channel, and that is likely here. However, a tight channel is a climax pattern. This means that a new high in the channel will probably be sold. If next week trades above this week’s high, there will probably be enough bulls taking profits and enough bear scalpers shorting so that the breakout will fail, and the tight bull channel will begin to evolve into a trading range.
The 4 earlier trading ranges within the big 2 year trading range have all lasted at least a month or two, and were about 100 points from top to bottom. There is no indication yet that things will be different this time. The selloff of the past 2 days is the 1st sign that a trading range might have started. Traders will know more if here is rally next week that goes above this week’s high. If it quickly reverses down, the odds are that the trading has begun. If the breakout is strong, the odds are the the Emini will test the October high and possibly the all-time high. At the moment, a trading range for the next month is more likely than a new all-time high.
Traders can see the end of the day bar-by-bar price action report by signing up for free at BrooksPriceAction.com. I talk about the detailed Emini price action real-time throughout the day in the BrooksPriceAction.com trading room, and a 2 day free trial is available.
When I mention time, it is USA Pacific Standard Time (the Emini day session opens at 6:30 am PST, and closes at 1:15 pm PST). You can read background information on the intraday market reports on the Intraday Market Update page.


