Monthly S&P500 Emini candle chart: Tight bull channel, but buy climax
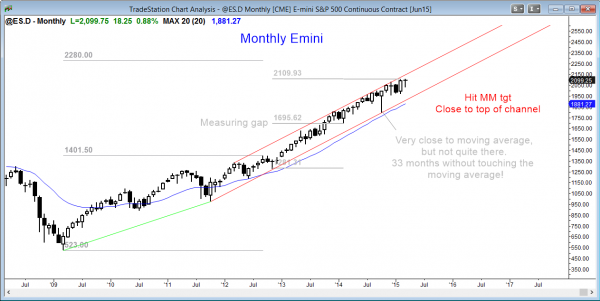
The monthly Emini candle chart is still in a bull trend, and this month is still forming an ioi breakout mode setup. The 60 minute chart is strongly up, which could make this month’s high go above last month’s high.
The monthly S&P500 Emini candle chart is in a tight bull channel, and this rally might last many more months. However, this is extremely rare behavior, and the last two times that it did not touch the moving average for 33 months were followed by 20% and 37% reversals within the next year. Although it might rally for several more months, traders learning to trade the markets should realize that the reversal will probably be much greater that what most TV pundits believe is possible.
Weekly S&P500 Emini candle chart: Breakout of a possible final bull flag
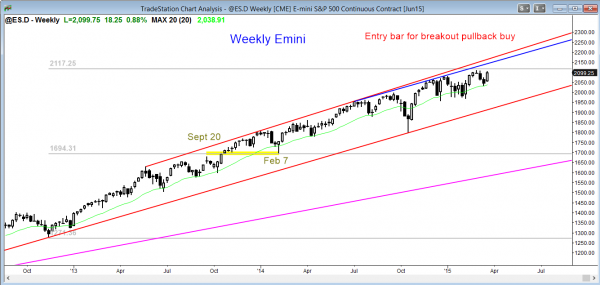
The weekly Emini candle chart is rallying after a breakout that pulled back to test the moving average. It is in a 2nd leg up from that breakout. However, it is at the top of a 20 bar tight trading range, which might become the final bull flag. This is a bull breakout but it might reverse.
The weekly S&P500 Emini candle chart is breaking above a possible final flag. Although a bull trend can go a long way, this one has lasted over a hundred bars, and that is extreme. It is also just below the top of the bull channel. There is probably limited upside over the next several weeks.
The weekly chart has been mostly in a trading range for 5 months and it is now at the top of the range. The odds are that any breakout will only last a few bars before it reverses back into the trading range. Less likely, there could be a strong bull breakout and a much stronger bull trend, but that is very unlikely.
Daily S&P500 Emini candle chart: Bull breakout but it might reverse
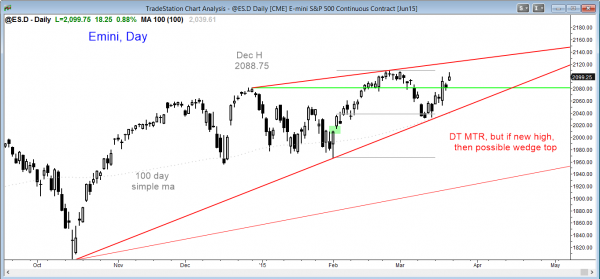
The daily Emini candle chart is in a broad bull channel. The rally over the past 2 weeks has formed a wedge and it testing the all-time high. It probably will pullback for a few days next week.
The daily S&P500 Emini candle chart has been a broad bull channel for more than a year. Bulls keep buying selloffs and then taking profits above the old highs. Bears are selling new highs and scaling higher, expect the pullbacks to continue.
The rally of the past 2 weeks is testing the all-time high. There could be a breakout and a measured move up. However, this rally has a wedge shape and it is within a bigger wedge that has been developing for 6 months. The market is deciding between a double top major trend reversal and a wedge top. If the bulls get the new high, which appears likely after Wednesday’s strong breakout, bears will short it, just as they have done profitably with every new high for over a year. However, because of the wedge top, the bears might begin to try to swing trade part of their positions.
The wedge of the past two weeks will probably be followed by a pullback for several days next week. If there is instead a strong breakout above the all-time high, the market could rally for a measured move up. More likely, bulls will continue to take profits at new highs and then buy pullbacks, and bears will continue to sell new highs.
Traders can see the end of the day bar-by-bar price action report by signing up for free at BrooksPriceAction.com. I talk about the detailed Emini price action real-time throughout the day in the BrooksPriceAction.com trading room, and a 2 day free trial is available.
When I mention time, it is USA Pacific Standard Time (the Emini day session opens at 6:30 am PST, and closes at 1:15 pm PST). You can read background information on the intraday market reports on the Intraday Market Update page.


