Monthly S&P500 Emini futures candlestick chart: Opportunity to learn how to trade a top
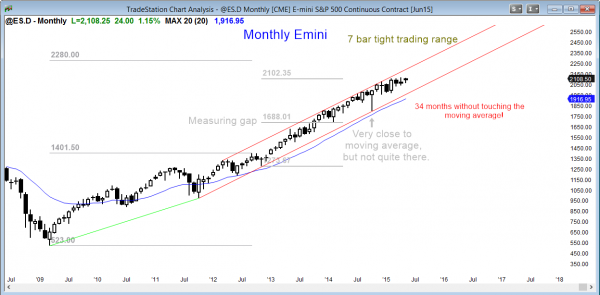
The monthly S&P500 Emini futures candlestick chart has been in a tight trading range for for 7 months.
The monthly S&P500 Emini futures candlestick chart is in a 7 month tight trading range and it has not touched the moving average in 34 months, which is exceptional. Fast Money yesterday finally had a technician on the show who made that point. He used the 200 day moving average as his measure of how extremely overbought the Emini is. He also used the 1987 crash as an example of a time when the market was above the moving average for a comparably long time. He correctly did not say that the current market is in any other way like that crash, but he did say that he expects a 10% correction.
Since the Emini has an 80% chance of getting back to the moving average this year and it is more than 10% below today’s close, I think that 10% is the minimum objective and that it might also test below the October low.
Weekly S&P500 Emini futures candlestick chart: Breakout mode
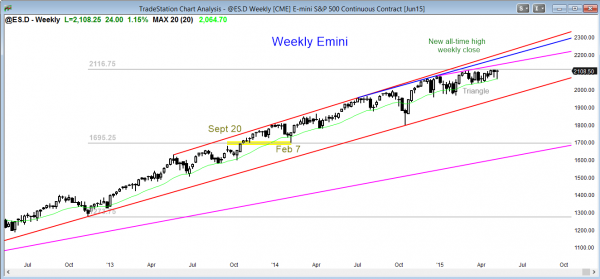
The weekly S&P500 Emini futures candlestick chart closed the week with a doji candlestick pattern within a 3 month tight trading range.
The weekly S&P500 Emini futures candlestick chart continues in its 13 week tight trading range. It is in https://www.brookstradingcourse.com/how-to-trade-manual/trading-ranges/#breakout-mode. Since this tight trading range is occurring late in a bull trend, a bull breakout will probably be followed by a final flag reversal.
Daily S&P500 Emini futures candlestick chart: Testing the top of the trading range
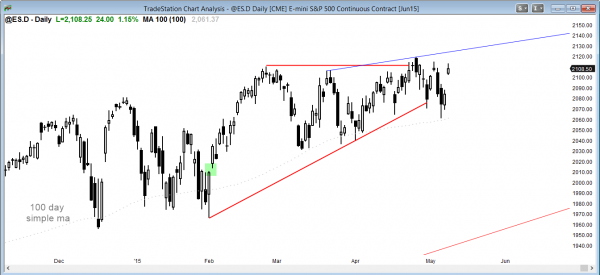
The daily S&P500 Emini futures candlestick chart is gapped up today, but it is still within the trading range.
The daily S&P500 Emini futures candlestick chart gapped up again today, but it is still below the all-time high. Bears are shorting this rally with a tight stop above the all-time high, betting that the Emini will begin to form a series of lower highs and then have s strong bear breakout. Whenever a stop is tight, the probability of success has to be low because there has to be a reason for an institution to take the other side of the trade. If the bears get great risk:reward, the bulls get higher probability. The candlestick pattern is an ascending triangle, and the probability is that it will have a bull breakout. However, a triangle forming late in a bull trend usually becomes the final bull flag before a correction.
Best Forex trading strategies
The dollar is oversold on the daily chart and has formed a wedge bull flag over the past month. For those trading Forex for a living, look for a bounce in the dollar over the next couple of weeks. The dollar rally was so climactic that this trend resumption, should it occur, will probably be within a developing trading range on the daily chart. This means that sideways for at least another month is likely.
The EURUSD rally has been strong on the daily chart, but the EURUSD began to turn down yesterday after a new high in a month long bull micro channel. Traders learning how to trade Forex markets should expect t trading range or pullback lasting at least a week. The rally was strong enough so that Forex price action traders expect that any selloff will form a higher low, and then a 2nd leg up. Less likely, this rally is forming a double top with the February high, and the selloff will fall below the neckline (March low) for a measured move down.
Traders can see the end of the day bar-by-bar price action report by signing up for free at BrooksPriceAction.com. I talk about the detailed Emini price action real-time throughout the day in the BrooksPriceAction.com trading room, and a 2 day free trial is available.
When I mention time, it is USA Pacific Standard Time (the Emini day session opens at 6:30 am PST, and closes at 1:15 pm PST). You can read background information on the intraday market reports on the Intraday Market Update page.


