Monthly S&P500 Emini futures candlestick chart: Weak buy signal
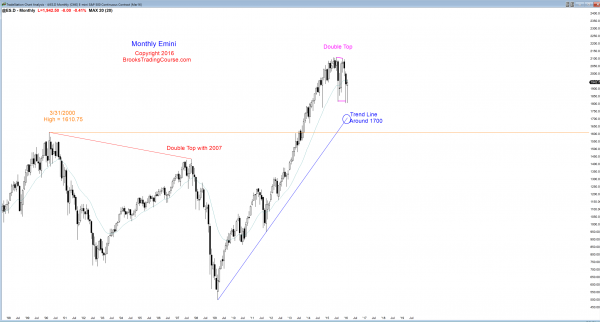
The candlestick on the monthly S&P500 Emini futures candlestick chart closes on Monday. February will be a weak buy signal candlestick pattern going into March.
The monthly S&P500 Emini futures candlestick chart is in a bull trend, but it had an extreme buy climax that ended in August. The correction so far has been about 14%, which is less than the 22% and 36% corrections that followed similar extreme buy climaxes in 1987 and 1998. The sample size is small, but at the moment there is a 60% chance that the Emini will break below the 2 year trading range and test lower support, like the bull trend line at around 1700. There is a 30% chance that it will test the double top in the 1500 to 1600 area.
The math is currently interesting because the Emini is in the middle of its 2 year range. This means that the top and bottom are about equally far away. The stop for the bulls is below the range, and their target is a breakout above the top. Their minimum reward equals their risk. The opposite is true for the bears. Their stop is above, and their minimum target is the bottom of the range, so their risk also equals their minimum reward. What is different is the probability. The bears have a 60% chance of success and the bulls have a 40% chance. What does this tell traders? Well, it means that this is a good area to go short or to buy puts. When the reward equals the risk and the probability is 60%, the Trader’s Equation is positive. This means that the trade makes sense mathematically. If a trader takes this trade 10 times and manages it correctly, the odds are that he will have a profit.
There is only one trading day left to the month and the Emini is near the high of the month. The month’s range is about 150 points. The midpoint of the month’s range is 60 points below. This means that the odds are high that February will close above its midpoint. That makes it a buy signal bar.
The monthly chart has a micro double bottom with January and a double bottom with August. The context is good for the bulls and now the bulls will have a buy signal bar. The odds are that March will trade above February’s high and trigger the buy signal to find out if there are more buyers or sellers above the bar. However, there is a 60% chance that the buy will fail and that there will be more sellers than buyers above the buy signal bar. The failure would then be followed by a breakout below the bottom of the 2 year trading range.
How can that be? It is because the combination of a weak buy signal bar and the extreme buy climax is enough to overwhelm the bull flag. The monthly chart is in a tight trading range. The buy will be above a doji in the top half of the range. That is a Limit Order Market, which means that there is a 60% chance that limit order bears selling above will probably outnumber stop order bulls buying above.
Weekly S&P500 Emini futures candlestick chart: Bear flag is more likely than bull trend
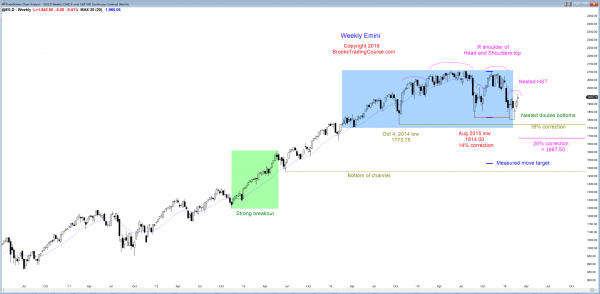
The weekly S&P500 Emini futures candlestick chart is testing the bottom of the 20 week EMA, which had been support for several years and is now resistance. The rally from the bottom of the 2 year trading range has been weak and has formed a bear flag.
The weekly S&P500 Emini futures candlestick chart broke above the high of 4 weeks ago, triggering a buy above the neck line of a small double bottom. The buy signal bar 3 weeks ago was a small doji, which is a weak buy setup. This reduces the probability of a significant rally. The entry bar 2 weeks ago was a bull bar, but it was not very big, and it had a conspicuous tail on top, which is caused by reluctant bulls.
This past week had a bull body, but it was a doji. This is weak follow-through buying. Finally, the rally stalled this week at the 20 week exponential moving average. That average was support during the 6 year rally from 2011, and now it is resistance. All of this makes the 3 week rally more likely part of a 2 legged bear flag than the start of a bull trend.
Although this week is a signal bar for a short for the Low 2 bear flag, it is a doji and there are 3 consecutive bull bodies. This makes it likely that there would be buyers below this week’s low. However, if there is a bear bar in the next 2 weeks that closes on its low, it could be a more reliable sell signal bar. Because there were 3 consecutive bull bodies, the odds are that the downside risk is small for at least another week or two. This is consistent with the monthly chart, which will probably trade above the February high within a couple of weeks.
Daily S&P500 Emini futures candlestick chart: Learn how to trade a bear rally
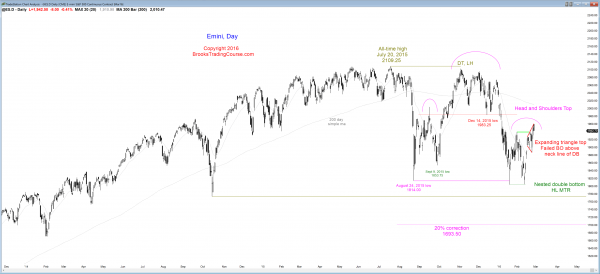
The daily S&P500 Emini futures candlestick chart got consecutive closes above the neck line of the two month double bottom, but Friday was a sell signal bar for a failed breakout and for an expanding triangle top.
The daily S&P500 Emini futures candlestick chart broke above the February 1 high, which was the neck line of the double bottom. Although Friday also closed above, it was a bear reversal bar. This is a sell signal bar for a failed breakout above the neck line of the double bottom. It is also the sell signal bar for the expanding triangle top that formed over the past 2 weeks. Since the 3 week rally was in a tight bull channel, the first reversal down will probably be bought.
However, if the reversal down is strong and has several follow-through big bear trend bars, this could be the start of the move to below the 2 year trading range. More likely, the Emini will have to trade sideways for 5 – 10 bars before it has enough selling pressure (bear bars, bars with big tails on top) to convince traders that the top is credible. Bull trends usually transition into trading ranges before they can become bear trends.
What can the bulls do to increase the probability of a move that will make a new all-time high from their current 40%? They need relentless buying, like they had in October. Even then, they probably cannot make the probability exceed 50%. The monthly buy climax is a problem for the bulls, and traders have been selling all rallies. That is why the Emini has been making mostly lower highs since July. The best the bulls can do for many months is make the market neutral again unless they get a breakout to a new all-time high.
Traders can see the end of the day bar-by-bar price action report by signing up for free at BrooksPriceAction.com. I talk about the detailed Emini price action real-time throughout the day in the BrooksPriceAction.com trading room, and a 2 day free trial is available.
When I mention time, it is USA Pacific Standard Time (the Emini day session opens at 6:30 am PST, and closes at 1:15 pm PST). You can read background information on the intraday market reports on the Intraday Market Update page.


