Monthly S&P500 Emini futures candlestick chart: Bull flag after buy climax
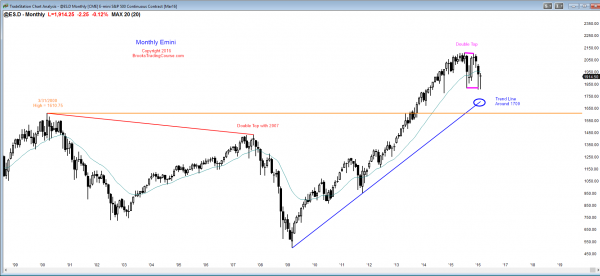
The monthly S&P500 Emini futures candlestick chart is still in a tight trading range after a buy climax. There are 6 days left to the month. Although the candlestick pattern is currently a reversal bar this month, it might look completely different once the bar closes.
The monthly S&P500 Emini futures candlestick chart has been sideways for a year. It has a micro double bottom over the past 2 months, which is the third leg down in a triangle that began with the selloff in October 2014. The 2nd leg down was the August selloff. The extreme buy climax favors the bears, but the trading range at the moving average in a bull trend favors the bulls.
There are 6 trading days left to the month. With the chart in a trading range, the odds are that the candlestick pattern at the end of the month will not be as important as the trading range. The only thing that would have predictive value would be a close below the January low, which is unlikely because it is 100 points away.
Even if the candlestick pattern is a strong bull trend bar, its high would be in the middle of the trading range, which would make it a low probability buy setup for next month.
If the bears get a strong breakout below the 2 year trading range, the first target is the bull trend line, which is currently around 1700. There is a 60% chance that the bears will get their breakout and a 40% chance of a rally to a new all-time high. The next major support is the double top around 1600. The 7 year rally broke above the double top, but never pulled back to test the breakout. There is a 60% chance of a test within the next few years, and a 30% chance of that test coming this year before a breakout to a new all-time high.
Weekly S&P500 Emini futures candlestick chart: Weak reversal up from bottom of 2 year trading range.
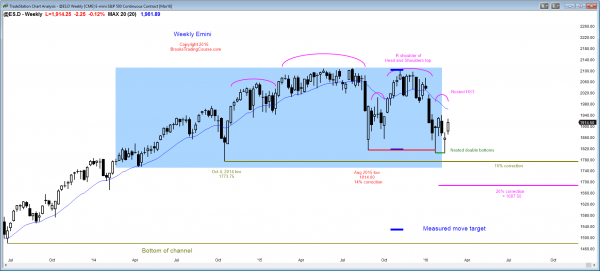
The weekly S&P500 Emini futures candlestick chart had a bull body this week, but it closed off its high and the body was not particularly big. This is not a strong entry bar after last week’s weak buy signal bar.
The weekly S&P500 Emini futures candlestick chart is in Breakout Mode. It has a double bottom, and this week’s rally might form a double top with the February high. It is also forming a nested Head and Shoulders Top. A nested pattern is one where the 3rd high (the right shoulder) subdivides into a smaller Head and Shoulders Top, and this slightly increases the chances that a bear breakout would fall for a measured move down. Given the strong selloff in January and the Emini still below the moving average, the odds are that the February trading range is a bear flag. Less likely, the Emini is reversing up from the support at the bottom of the 2 year trading range.
Daily S&P500 Emini futures candlestick chart: Learn how to trade bullish price action at resistance
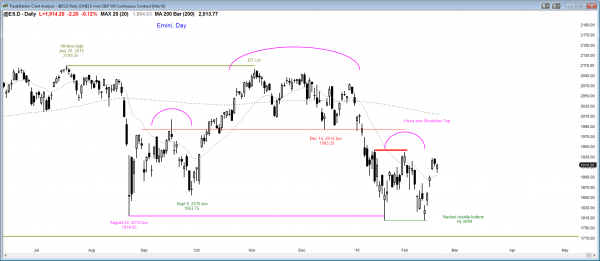
The daily S&P500 Emini futures candlestick chart is rallying strongly, but it is just below the top of a trading range.
The daily S&P500 Emini futures candlestick chart reversed up strongly for 4 days. Although it pulled back today, the odds are that the rally was strong enough to have a 2nd up. Since it formed within a month-long trading range, it might be just a bull leg within the trading range and a test of the resistance at the top of the range. If so, it might be followed by a deep pullback to near the bottom of the trading range. More likely, the pullback will last for only 1 – 3 days and be followed by a test of the February lower high of 1940. If the bulls can break strongly above that lower high, they would then have a 50% chance of a test of the all-time high. Without that strong bull breakout, there is a 60% chance of a break below the 2 year trading range without there first being a test of the all-time high.
Traders can see the end of the day bar-by-bar price action report by signing up for free at BrooksPriceAction.com. I talk about the detailed Emini price action real-time throughout the day in the BrooksPriceAction.com trading room, and a 2 day free trial is available.
When I mention time, it is USA Pacific Standard Time (the Emini day session opens at 6:30 am PST, and closes at 1:15 pm PST). You can read background information on the intraday market reports on the Intraday Market Update page.


