Monthly S&P500 Emini candle chart: Small pullback bull trend
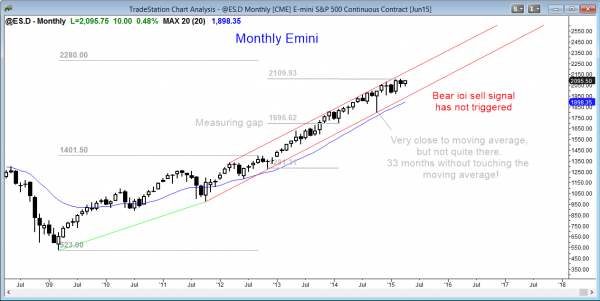
The monthly Emini candle chart is overbought, but in a small pullback bull trend, which is the strongest type of bull trend.
The monthly S&P500 Emini candle chart has an ioi sell setup in a buy climax, but it has not triggered the short. There is no sign of a top, but because it is so overbought, a reversal down to the moving average can begin at any time.
Weekly S&P500 Emini candle chart: Breakout of bull flag
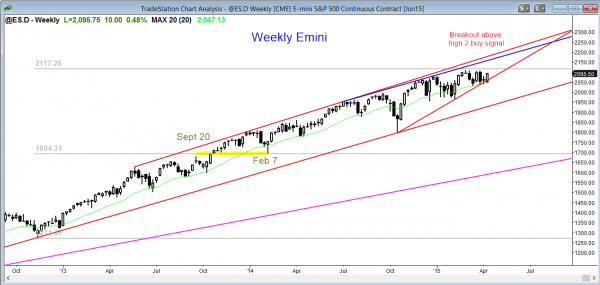
The weekly Emini candle chart broke above a high 2 (ABC) bull flag at the moving average. This might become the final bull flag before a correction.
The weekly S&P500 Emini candle chart is breaking out of a high 2 bull flag at the moving average. This is the 3rd push up from the October low and the bull trend channel has a wedge shape. Although the odds favor a new all-time high, traders will watch for a reversal at the top of the channel above the current all-time high. Since the monthly chart is so overbought, traders are looking for reasons to sell. If the weekly breakout forms, but fails, traders will short the wedge top as it reverses down. Until then, the Emini is still in a strong bull trend.
Daily S&P500 Emini candle chart: Bull trend breakout above double top
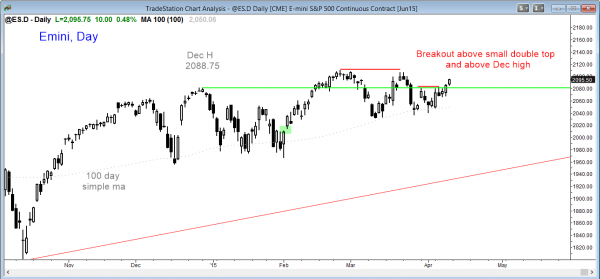
The daily Emini candle chart broke above the month long double top and this rally will probably test the all-time high.
The daily S&P500 Emini candle chart is still in a broad bull channel. A new all-time high has become more likely with this week’s breakout above the double top of the past month. This is especially true since February through April is one of the strong times of the year. Bears have been profitably shorting new all-time highs for over a year, and they will sell this one, too, if the Emini gets there. Since the Emini is in a bull trend channel, traders learning how to trade the markets should realize the it is better to buy pullbacks and not breakouts to new highs. That is where skilled bull swing traders take partial or full profits. It is not where they buy new position.
Traders can see the end of the day bar-by-bar price action report by signing up for free at BrooksPriceAction.com. I talk about the detailed Emini price action real-time throughout the day in the BrooksPriceAction.com trading room, and a 2 day free trial is available.
When I mention time, it is USA Pacific Standard Time (the Emini day session opens at 6:30 am PST, and closes at 1:15 pm PST). You can read background information on the intraday market reports on the Intraday Market Update page.


