- Market Overview: Weekend Market Analysis
- 30-year Treasury Bond futures
- Bond futures on weekly chart are bouncing at bottom of a 9-month triangle
- EURUSD Forex market
- EURUSD on weekly chart has weak follow-through after last week’s strong bull breakout
- S&P500 Emini futures
- Monthly Emini chart has weak follow-through after November’s strong bull breakout
- Weekly S&P500 Emini futures chart has wedge top sell signal, but weak sell signal bar
- Daily S&P500 Emini futures chart reversing down from an OO and wedge top
Market Overview: Weekend Market Analysis
The SP500 Emini futures might be forming a wedge top on the daily and weekly charts at yearend. But there might be one more new high before there is a reversal down.
Bond futures have been in a tight trading range for 7 weeks, and they are at the apex of a 9-month triangle. They bounced this week. They can continue sideways indefinitely before they break out. Once they do breakout, down is more likely.
The EURUSD Forex market had slight follow-through buying this week after last week’s strong breakout. The rally should reach the February 2018 high above 1.25, but there is a possible wedge on the weekly chart. That could lead to a pullback to the November low before the rally reaches the 1.25 target.
30-year Treasury Bond futures
Bond futures on weekly chart are bouncing at bottom of a 9-month triangle
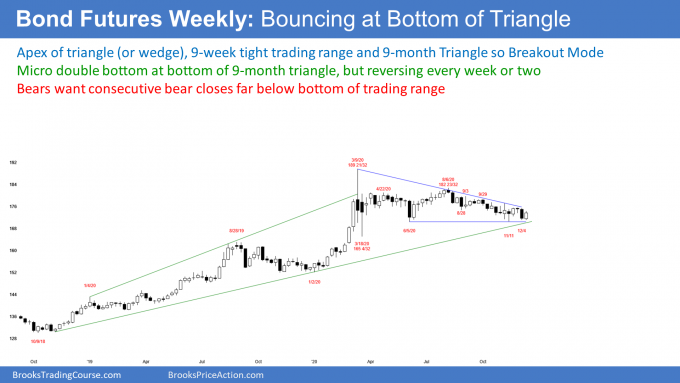
The weekly bond futures have been in a triangle for 9 months. This week reversed up from a micro double bottom with the low of 4 weeks ago. The reversal is just above the June low, which is the bottom of the triangle.
A triangle (and any other type of trading range) is a Breakout Mode pattern. Since the bonds have been trading down from the August high, the odds slightly favor a bear breakout. But that is the nature of Breakout Mode patterns. They always look like they are about to break out, but most of the breakout attempts reverse.
Last week was a big bear bar, but this week’s reversal up erased much of that bearishness. Next week is important. If it is a 2nd bull bar, and if the bar is big and closes on its high, traders will conclude that the rally will probably have a couple legs up and test the bear trend line.
If next week collapses to below the June low, traders will look for a test of the March low. But next week will probably not collapse. If next week is a bear bar, it will probably be small.
If next week stays within this week’s range, there would be consecutive inside bars. An ii (inside-inside) pattern is a Breakout Mode pattern. That does not alter the probability of the direction of the breakout.
Since the weekly bond market is also at the apex of a triangle, traders already know that it is in Breakout Mode. Traders assume that the probability of a bear breakout is about the same as for a bull breakout. Furthermore, they believe that the 1st breakout up or down will fail.
Bonds are neutral going into next week
What about next week? The bond market has been in a tight trading range for 7 weeks. Every week has reversed the week before, or provided no follow-through. Traders will expect the same next week. That means a small bear or bull bar is more likely than a big trend bar up or down.
As I said, the weekly chart has formed a triangle and the bond market is at the apex. That increases the chance of a breakout attempt within a few weeks. But since most breakouts fail, the breakout is more likely to reverse than lead to a trend. Until there are consecutive strong closes above or below the triangle, traders will continue to bet on reversals instead of trends.
One final point. I keep saying that bonds will be lower in 5 years. That means higher interest rates, and it means that they will break below the 9-month trading range. But I also keep saying that bonds could drift back up to the top of the trading range, or even to a new high while everyone waits for the bear breakout.
EURUSD Forex market
EURUSD on weekly chart has weak follow-through after last week’s strong bull breakout
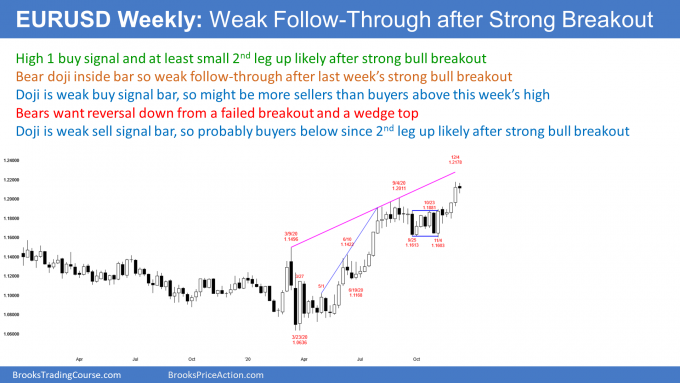
The EURUSD Forex weekly chart formed an inside bar this week. Last week was a big bull bar that broke above a 4-month trading range. This week was the follow-through bar.
A follow-through bar often gives traders an idea of what to expect over the next several bars (weeks). This week was an inside bar with a small body. It is therefore neutral. Traders then look back for the last time things were clear. That obviously was last week’s big bull bar. Neutral after bullish usually means a pause. Traders expect at least a small 2nd leg up. However, the chart could remain neutral (go sideways) for several more bars (weeks) before resuming up.
If this week was a big bear bar closing on its low, traders would have concluded that the breakout failed. They then would be looking for a reversal down next week.
1st reversal down will probably be minor
The bears can still get their reversal down, even with this week being neutral. For example, if next week is a 2nd consecutive inside bar (an ii pattern, which is inside-inside) and it closes on its low, many traders will sell below that bear bar. A breakout or a buy climax sometimes reverses from an ii pattern. But without that or a big Bear Surprise Bar next week, traders will expect at least slightly higher prices for a week or more.
Can the rally continue straight up to the February 2018 major lower high without a pullback? That is unlikely. The rally is in its 3rd leg up from the March low, and it is climactic. Traders expect a pullback, which means a minor reversal. The trend should continue up to the February 2018 high of 1.2555, some time next year.
If the rally begins to pull back within the next few weeks from around the top of the wedge channel (currently above 1.23), traders will look for a couple legs down. The September to November trading range might be the Final Bull Flag. If there is a reversal down, it will probably fall to the middle or bottom of that range.
S&P500 Emini futures
Monthly Emini chart has weak follow-through after November’s strong bull breakout
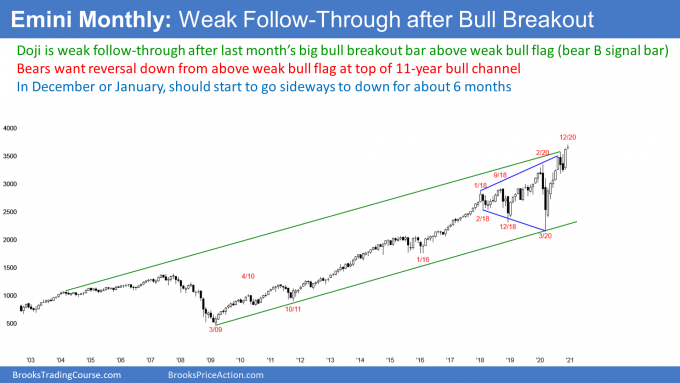
The monthly S&P500 Emini futures chart had a big bull bar in November and it closed far above the October high. It is a breakout bar, but is it coming late in a bull trend, which began a decade ago.
A breakout late in a bull trend usually attracts profit taking. There is often a pause and a brief 2nd leg up (a bar or two) before the profit taking begins. The reversal down should have at least a couple legs and last 5 – 10 bars. Since this is a monthly chart, traders should expect a trading range to begin early next year, and last at least into the summer.
So far, no follow-through buying in December
This month so far is a small bear doji bar. That is not what the bulls want to see after a big breakout. They were hoping for a 2nd consecutive big bull bar closing on its high. That would increase the chance of higher prices in January. There is still plenty of time remaining in December for that to happen, but it has not happened yet. If December closes near its low, it will be a sell signal bar for January.
The lack of follow-through buying increases the chance that November was an exhaustive buy climax. If it was, disappointed bulls will start to exit, which would result in at least a minor reversal.
I have been saying that the October bear bar was a bad High 1 buy signal bar. I said that the breakout above a bad bull flag usually goes up for a couple bars (months), and then there is a bigger pullback. There was a 2-month pullback in September and October. If November was an exhaustive move, it will probably lead to at least a couple legs sideways to down. That should take at least 5 bars (months), which mean about the 1st half of 2021.
Will the Emini reach JP Morgan’s target of 4,500 in 2021?
What about all of the bulls on TV who are saying that the Emini will reach 4,000 to 4,500? JP Morgan’s prediction is 4,500. They are basing their projection on fundamentals, which contain many assumptions. If the Fed continues to be supportive and there are no Black Swans (unexpected disasters), they might be right. However, the charts do not look like this will happen.
I will post a yearly chart at the end of the year (a chart where every bar is one year). This year is a huge outside up bar and it is coming late in a bull trend. A big outside up bar early in a bull trend is very bullish. When it comes late in the trend, if more often is an exhaustive buy climax.
A buy climax does not mean the start of a bear trend. But it does mean a pause in a bull trend. Traders look for the market to go sideways to down for at least a couple legs and 10 or more bars. At that point, it can resume up or reverse down.
I am talking about the yearly chart. Ten or more bars means a trading range lasting 10 years. That is what is likely. It might have begun in 2018.
A 10-year trading range after a strong rally on the yearly chart is common. Just look back at the 1970’s and the 2000’s. The market was sideways for about 10 years, and it sold off between 40 and 70% several times. Welcome to the 2020’s!
The yearly chart has always been in a bull trend
Since the stock market has always been in a bull trend on the yearly chart, even if it were to go sideways for 10 bars, it would be a bull flag. As long as the world’s population is increasing and the productivity is increasing, the world’s wealth will increase. That means that the stock market will go higher.
This will not last forever. There will never be 100 trillion people in the world. Once the world’s population peaks, the stock market will be much more sideways for centuries, and much less up.
That is not going to happen in our lifetime. The market will continue higher. With 70% of the years being up, it makes sense for the institutions to always be bullish about the coming year.
Weekly S&P500 Emini futures chart has wedge top sell signal, but weak sell signal bar
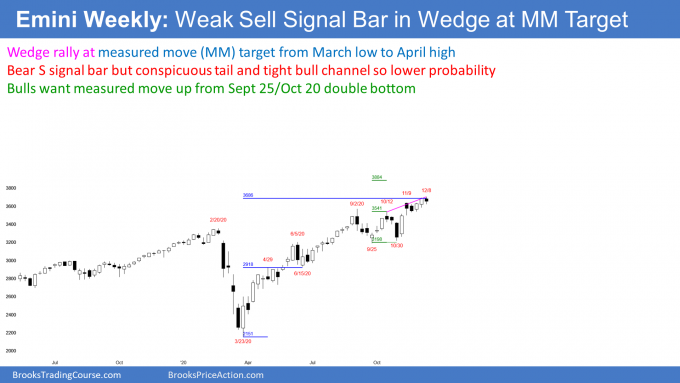
The weekly S&P500 Emini futures chart had a bad bull flag 3 weeks ago. There were consecutive bear bars and they came late in a bull trend. I said that there might be a rally for a couple bars (weeks), but then traders should expect more of a pullback. This 2-bar bad bull flag is similar to the one on the monthly chart. Both increase the chance of a trading range developing soon.
This week was a bear bar, and it is therefore a sell signal bar for next week. There have been 3 legs up from the September 24 low. Consequently, this rally is a wedge bull channel.
A wedge top is also a possible higher high major trend reversal. Will it lead to a bear trend? Only 40% of major trend reversals actually lead to a major trend reversal, which means a bull trend reversing into a bear trend.
If there is a series of big bear bars over the next few weeks, then traders will conclude that a major reversal is underway. But more often, the reversal will turn out to be minor. That means a trading range or a bull flag. Once in a trading range, the bulls will try to create trend resumption up, while the bears will look for a trend reversal down.
Daily S&P500 Emini futures chart reversing down from an OO and wedge top
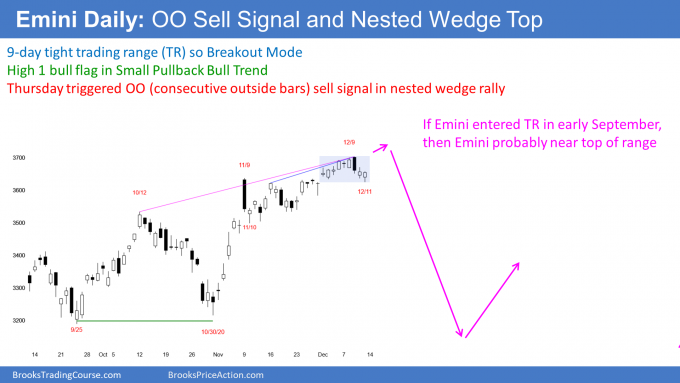
The daily S&P500 Emini futures chart has been in a tight trading range for 9 days after breaking above the November 9 high. The rally from the November 10 low is a Small Pullback Bull trend, which is a tight bull channel. A bull channel usually has a bear breakout. It then typically evolves into a trading range.
It is important to note that Tuesday traded below Monday’s low and then above Monday’s high. It was therefore an outside up day. But Wednesday was outside down. There were consecutive outside bars. This is an OO pattern (Outside-Outside), and there is usually also an expanding triangle on a smaller time frame.
An OO is a Breakout Mode pattern. When Thursday traded below the OO, it triggered a daily sell signal. There is also a micro wedge top.
Thursday had a bull body, which means it was a weak entry bar. Friday was a bull bar closing near its high. It is therefore a buy signal bar.
The bulls hope that the bull trend is resuming. The bears want a lower high and a 2nd leg down. But even if the bulls get a new high, the 3 week rally is probably a bull leg in a trading range. Traders should expect a reversal down. It will probably come this month, but it might not begin until January. This week’s reversal down could be the start, but the bears need more and bigger bear bars next week. Otherwise traders will expect a new high.
A reversal from a buy climax usually has a couple legs and lasts about 10 bars
When a bull channel has 3 legs up and then reverses down, the channel is a wedge top. This is true even if the channel is not contracting. My rule of thumb for what to expect is TBTL… Ten Bars, Two Legs. The pullback can be sideways or down, and it can last much longer than 10 bars. Sometimes it can be as brief as 5 bars.
After a couple legs down, the bulls will assess the strength of the bears. If the reversal down looks like a bear trend, the bulls will wait for the selling to dry up before buying. But if the selling is weak, the bulls will buy again. They want to see the bears make a couple attempts to create a bear trend and fail both times.
That is why I say that the reversal from a buy climax usually has at least a couple legs. This usually takes about ten bars. Sometimes the bears make a 3rd attempt. If it fails, the selloff is a wedge bull flag. Once the bulls are confident that the bears will give up, the bulls buy, looking for a resumption of the bull trend.
Pullback likely to begin within a few weeks
So what about now? The bears have not yet done enough to convince traders that the reversal down is underway. There might be one more brief new high before the reversal begins. The reversal could come as late as early January.
The rally from the October low has lacked streaks of consecutive bull bars closing near their highs. In fact, most days have closed in the middle or near the open. When a rally looks like that, it is usually a bull leg in a trading range and not the start of a bull trend. Also, the High 1 bull flags on the weekly and monthly chart are weak.
These factors make a pullback likely soon. The minimum target for the bears would be the middle of the 3 month trading range. That means below 3500.
Trading Room
Traders can see the end of the day bar-by-bar price action report by signing up for free at BrooksPriceAction.com. I talk about the detailed Emini price action real-time throughout the day in the BrooksPriceAction.com trading room. We offer a 2 day free trial.
Charts use Pacific Standard Time
When I mention time, it is USA Pacific Standard Time (the Emini day session opens at 6:30 am PST, and closes at 1:15 pm PST). You can read background information on the intraday market reports on the Market Update page.

