Monthly S&P500 Emini futures candlestick chart:
Weak buy signal
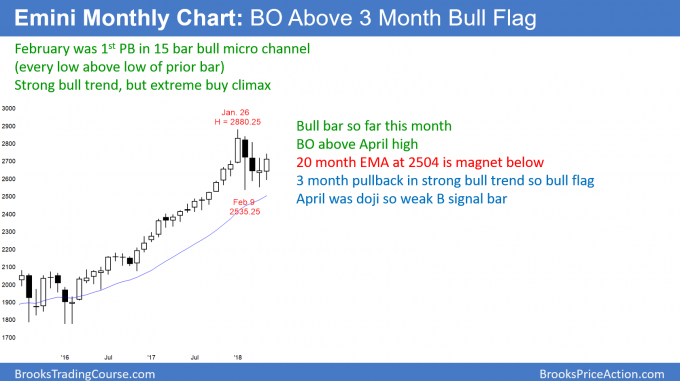
The monthly S&P500 Emini futures candlestick chart traded above the April high. This triggered a buy signal. However, April was a doji bar and therefore a weak signal bar. So far, May is a bull bar, but it is currently only at the April high and not far above.
The monthly S&P500 Emini futures candlestick chart has a 4 month bull flag. Since May broke above last month’s high, the bulls hope that the bull trend is resuming. Yet, each candle stick for the past 3 months has had prominent tails. This is a tight trading range and a magnet. It resists breakouts. Therefore, the bulls need May to close on its high, and preferably far above the April high. In addition, they need June to be a bull trend bar as well. Otherwise, the odds favor more sideways bars in the 4 month tight trading range.
The bulls had a 15 month bull micro channel that ended when February traded below the January low. After such a strong bull trend, there is only a 20% chance of a bear trend on the monthly chart without at least a small double top. Therefore, the downside risk is probably limited to a 5 – 10 bar pullback and maybe a tested below the 20 month EMA. If the Emini pulls back to the EMA, it will likely fall at least 30 – 50 points below. That means that a break below the February low would probably continue down to at least 2450.
Weekly S&P500 Emini futures candlestick chart:
Bar follow-through after last week’s breakout above a triangle
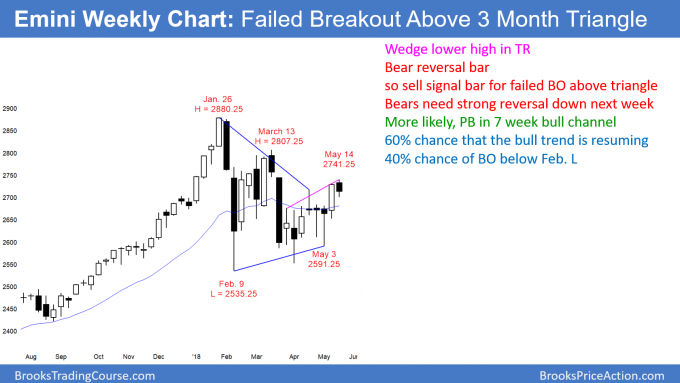
The weekly S&P500 Emini futures candlestick chart this week was a bear bar. This is bad follow-through after last week’s breakout above a 3 month triangle.
The weekly S&P500 Emini futures candlestick chart broke above a 3 month triangle two weeks ago, but this past week was a bear bar. That lack of follow-through buying reduces the chance that the breakout will be successful. Fifty percent of triangle breakouts fail.
The bears see this week as a sell signal bar for a failed breakout. Since the bar is not big, it is not a strong sell setup. The probability still slightly favors the bulls. The bulls need follow-through buying next week. If they fail to get it, the trading range is likely to continue.
Alternatively, if the bears get a big bear bar next week, then the bull breakout will have failed. The weekly chart would then either stay sideways or continue to fall and have bear breakout.
Daily S&P500 Emini futures candlestick chart:
Emini weak bull flag after breakout above April high
The daily S&P500 Emini futures candlestick chart pulled back this week after a breakout above the April 18 major lower high. The bears have a micro double top, but the 4 day tight trading range is more likely a bull flag.
The daily S&P500 Emini futures candlestick chart has been oscillating around the April 18 major lower high for 7 days. The bulls need follow-through buying next week. Since the rally from the May low was strong, the odds favor at least slightly higher prices next week.
However, the bears see Friday as a 2nd entry short for a failed breakout above the April 18 lower high. If they get 2 big bear trend days next week, they will probably get another test back down to the bottom of the 4 month trading range.
Traders can see the end of the day bar-by-bar price action report by signing up for free at BrooksPriceAction.com. I talk about the detailed Emini price action real-time throughout the day in the BrooksPriceAction.com trading room. We offer a 2 day free trial.
When I mention time, it is USA Pacific Standard Time (the Emini day session opens at 6:30 am PST, and closes at 1:15 pm PST). You can read background information on the intraday market reports on the Intraday Market Update page.


