Market Overview: Weekend Market Analysis
The SP500 Emini futures market had a strong end of quarter rally on Thursday and Friday. The Emini might gap up to a new all-time high on Monday on the daily and weekly charts. In addition, April could gap up on the monthly chart on Wednesday. While the Emini is at the top of the 2021 trading range at end of 1st quarter, traders expect higher prices. The bears need a strong reversal down to make traders think that a pullback to 3,700 is about to begin, and that is currently unlikely.
The Bond futures weekly chart had its 1st bull bar in 10 weeks this week. It should soon enter a trading range for the next month or two, even if it continues down to the January 2020 low first.
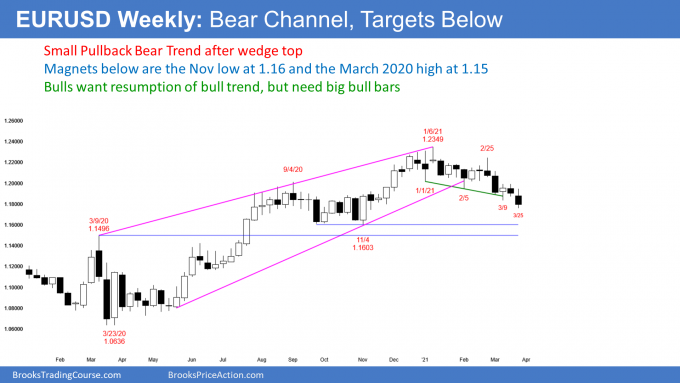
The EURUSD Forex has been selling off since the wedge top on the weekly chart reversed down on January 6. The November 4 low at 1.16 and the March 2020 high of 1.15 are magnets below, but the EURUSD could bounce for a couple weeks before getting there.
30-year Treasury Bond futures
The Bond futures weekly chart: Early short-covering bounce

- After 9 consecutive weeks with bear bodies, there was finally a bull body this week.
- Streak of 9 consecutive bear bars indicates relentless selling, but it is also unsustainable and therefore climactic. The bull bar this week represents the 1st sign of short covering.
- This week is a pullback in a strong bear trend. It is therefore a Low 1 sell signal bar.
- A bull bar in a sell climax in a support zone is a minor sell signal. If it triggers, there will probably be buyers below within a couple weeks.
- 1st reversal up in strong bear trend is typically minor. There is a 70% chance of a trading range or bear flag, and only a 30% chance that this is the start of a bull trend reversal.
- Bond futures are back in the late 2019 trading range. Since traders thought this was a fair price then, they might think it is fair again now. Increased chance of trading range for a couple months.
- Pullback after sell climax usually has at least a couple legs up. If this is the end of the sell climax, bonds will probably be sideways to up for several weeks and maybe a couple months.
- If there is a new low within a few weeks, traders will expect it to reverse up within a couple weeks, and then lead to a trading range for a month or two.
EURUSD Forex market
The EURUSD weekly chart: Getting drawn down to November low at 1.16

- Accelerating down in 3-month bear trend after yearlong wedge top.
- Minor support at November 11 low at 1.1746.
- I have been saying since January, that the 1st major target for the bears is the bottom of the final leg up in the wedge. That is the November low at 1.1603.
- EURUSD is close enough to that 1.16 support, so that it probably cannot escape its magnetic pull. It should get there within a couple months, and possibly in April.
- The next target is the 1.15 Big Round Number. It is a 50% retracement of the 2020 rally and almost exactly at the March 2020 high, which was the breakout point for last summer’s rally. The EURUSD should get there before there is a rally above the January 2021 high.
- Bears hope this is a reversal down, from a double top bear flag on the monthly chart (not shown). The 1st high was February 2018. I will write about the monthly chart next week.
- This selloff is more likely a pullback from last year’s rally, than a resumption of the 14-year bear trend. But, the 7-year trading range could continue for several more years.
- 3-month selloff has been in Small Pullback Bear Trend. There have been several 1- to 3-week pullbacks. Another one can happen anytime.
- After each new low for 3 months, there was bounce back above prior low. Probably will get bounce soon to back above March 9 low.
S&P500 Emini futures
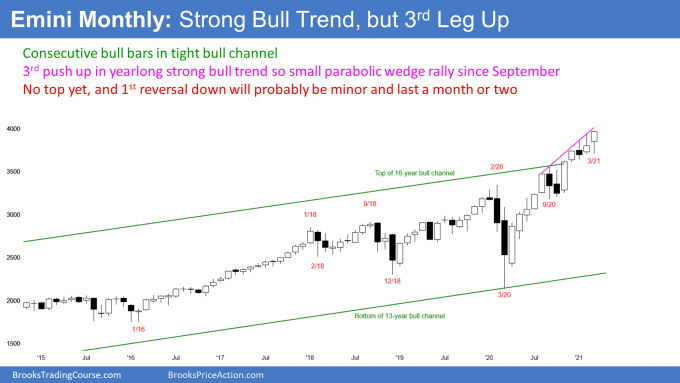
The Monthly Emini chart: Strong bull trend, might gap up in April

- 13-month strong bull trend with no top. The bulls want March to close above the February high. April might then gap up on Thursday.
- January and February had prominent tails on top, which was created by profit taking at end of the months. It is a loss of momentum. If March pulls back this coming week, and has a tail when it closes on Wednesday, there would be an increased chance of more sustained profit taking soon.
- 3rd leg up since September high, so parabolic wedge rally. That is a buy climax and increases the chance of profit taking. But the bears need to create a bear bar before traders will look for a pullback.
- Only 1 pullback (September) in over a year so bulls have been very eager to buy. They will buy next 1- to 2-month selloff.
- On the monthly chart, a brief pullback can still be big. There was a 2-bar pullback last year, which was a 35% selloff. The 1st pullback in the current bull trend should be only 10 to 20%.
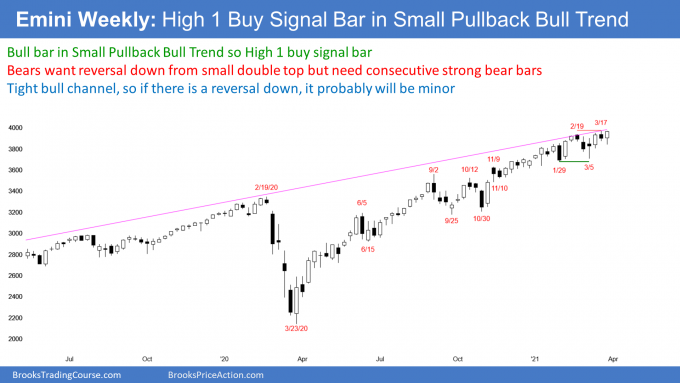
The Weekly S&P500 Emini futures chart: High 1 bull flag at all-time high, might gap up next week

- Emini has been in a tight bull channel since November, but it has been mostly sideways since early January.
- Last week was sell signal bar for small double top.
- This week traded below last week’s low, which triggered the sell signal.
- However, this week closed back at the high of the week. It is therefore a High 1 bull flag buy signal bar for next week.
- The strong close and the end of quarter window dressing, increase the chance of higher prices next week. The Emini might even gap up to a new all-time high on the weekly chart on Monday.
- If the Emini sells off, it will probably bounce at the bottom of the 2021 trading range at 3,700.
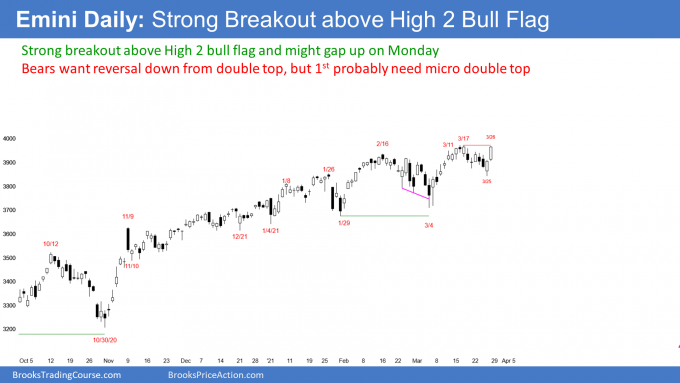
The Daily S&P500 Emini futures chart: Strong breakout above High 2 bull flag — Might gap up to new high on Monday

- Triggered High 2 bull flag buy signal bar on Friday.
- Thursday reversed up sharply from the open of the month, and Friday reversed up strongly from the open of the week. Strong reversals up from sharp selloffs to support make higher prices likely.
- Strong 2-day rally to just below the old high. Might gap up to a new high on Monday.
- 1st quarter ends on Wednesday, and this week began end of the quarter window dressing. Portfolio managers use their cash to buy the strongest stocks, so that they will look smart when the quarterly report comes out.
- Bulls want March and the quarter to end at a new high, and above the 4,000 Big Round Number.
- Strong bull trend and strong 2-day rally. Odds favor higher prices next week.
- Broad bull channel since start of year. That is a weak bull trend, and the 3-month rally might end up being a bull leg in a trading range.
- Bottom of range is the collection of lows at around 3,700. If this is a trading range, the Emini should test the bottom of the range before going much high.
- Bears need strong reversal down next week, which is unlikely. That would be a double top with the March 17 high, and a higher high major trend reversal with the February high.
- Traders expect higher prices. Might get gap up on Monday on daily and weekly charts, and then a gap up on Thursday on Monthly chart.
Trading Room
Traders can see the end of the day bar-by-bar price action report by signing up for free at BrooksPriceAction.com. I talk about the detailed Emini price action real-time throughout the day in the BrooksPriceAction.com trading room. We offer a 2 day free trial.
Charts use Pacific Time
When I mention time, it is USA Pacific Time (the Emini day session opens at 6:30 am PT, and closes at 1:15 pm PT). You can read background information on the intraday market reports on the Market Update page.

