Market Overview: Weekend Market Update
The Emini should continue a little higher, but 3,000 – 3,100 is the Sell Zone for at least a 10% pullback.
The monthly bond futures chart has an ii Breakout Mode pattern after an extreme buy climax. It will likely be mostly sideways in a tight range for several more months.
The monthly EURUSD Forex chart has an ioii Breakout Mode pattern. Since it has been unable to get above the 20 month EMA for 2 years, there is a slightly higher probability of a bear breakout.
30 year Treasury Bond futures monthly chart:
ii Breakout Mode pattern after extreme buy climax
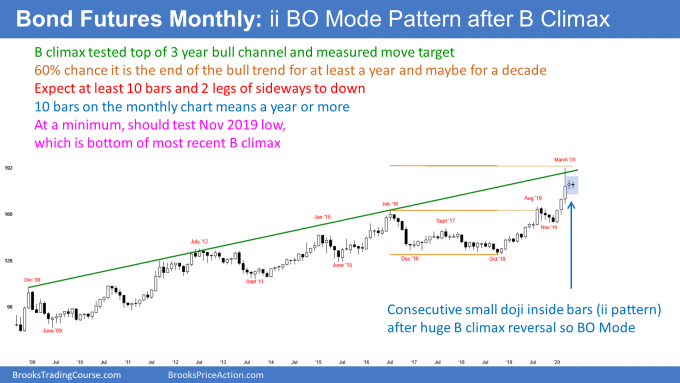
The 30 year Treasury bond futures market had the biggest 3 month rally in the history of the market early this year. It was therefore unsustainable and climactic.
The bond market sold off strong at the end of March. March then closed in the middle of its range. April’s high was below the March high and April’s low was above the March low. April was an inside month.
May so far is within April’s range. This is therefore an ii (inside-inside) Breakout Mode pattern. That means that the chance of a bull breakout is about the same as for a bear breakout.
With the very small ranges for 2 months, there is not much energy in the bond market. That reduces the chance of a strong breakout coming within the next few months. If there is a breakout, it will likely lead to more sideways bars than to a trend.
Limited upside after extreme buy climax
Since the ii Breakout Mode pattern is coming immediately after an extreme buy climax, the bulls are not eager to buy. After extreme profit-taking like this, they typically want to wait for about 10 bars (here, months) before they will try to resume the trend.
The bulls want to be sure that the bears cannot begin a trend reversal down. If the bears make 2 attempts down and fail, the bulls will start to buy. But two attempts typically take about 10 bars, which is about a year.
Any buying before then is usually for a trade. They will take quick profits. Consequently, the upside over the next few months is not great.
What are the targets for the bears?
But what about the downside? There is a 70% chance of a test of the January low before there is a break above the March high. When there is a reversal down from a buy climax, the 1st target is the bottom of the buy climax. That usually is also around the 20 month EMA. But with the loss of momentum, the bond market might take all year to get down to that January low.
Also, I have said many times that the U.S. will not have negative interest rates, despite what President Trump wants. Therefore, the odds are against the bond market every going much above the March high. It may never get above that high.
EURUSD Forex monthly chart:
ioii Breakout Mode pattern in weak bear trend
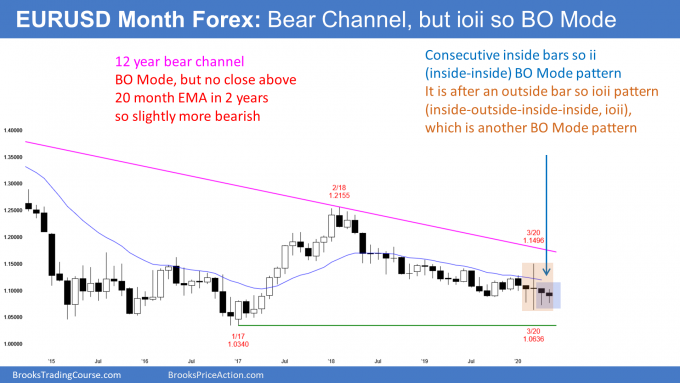
The EURUSD Forex monthly chart has been sideways for a year. The range in March was huge. Its high was the high of the prior 12 months and its low was the low of the prior 12 months.
April’s high was below the March high and its low was above the March low. April was therefore an inside bar.
Since March was an outside bar, February was inside of March. This is an ioi (inside-outside-inside) Breakout Mode pattern.
So far, May is within the April range, so there now consecutive inside bars, which is a ii (inside-inside) Breakout Mode pattern. The entire 4 months is now ioii.
Unreliable Breakout Mode pattern
In general, the chance of a bull breakout is the same as for a bear breakout. But there has been only one close above the 20 month moving average in 2 years. Therefore, even though the bear channel is almost flat, the bears have been consistently a little stronger. Consequently, there is a slightly greater probability of a bear breakout. If the bears get their breakout, traders will look for a test of par (1.0).
A Breakout Mode pattern is both a buy and sell signal. If May falls below April’s low, May would trigger a sell signal. If it goes above April’s high, it would trigger a buy signal. Sometimes it does both. Whichever it does more recently is the currently active signal.
Problems that make this ioii Breakout Mode pattern less reliable
There are problems with this ioii setup. All 4 bars are dojis. That means there is no sustained energy. No one is strongly committed to a direction. Therefore, there will be no trapped traders who will be forced to exit in a panic if wrong. That reduces the probability that a breakout of April’s range will result in a trend.
Additionally, Breakout Mode patterns have a better chance of leading to a trend when they come at the end of a strong trend up or down. The current ioii is coming in the middle of a yearlong tight trading range.
Markets have inertia. They have a strong tendency to continue what they are currently doing. That increases the chance that there will be buyers below and sellers above, resulting in a continuation of the trading range.
Will a breakout lead to a trend?
If the breakout is strong, traders will look for a trend. For example, if June is a big bear trend bar closing on its low and far below the May low, traders would expect lower prices. The opposite is true of a strong bull breakout.
But look at the chart. Many bars went above or below the prior month’s range over the past 2 years. In every case, the breakout reversed within a couple months and the trading range continued. This is what is most likely here as well.
Markets do not stay in tight trading ranges forever. Traders know that there will be a successful breakout up or down at some point. With this trading range lasting as long as it has, the breakout will probably come this year. But until there is a clear, strong breakout, traders will continue to bet on reversals.
Covid-19 update
The coronavirus pandemic is going to affect all financial markets for at least another year. I continue to think that the press and the TV pundits are doing a poor job reporting the story. Also, both political parties in Washington are doing a terrible job managing it.
As the CDC gets more data, they get a clearer picture of how the pandemic is affecting us. This week, they announced that 35% of infected people have no symptoms, but that they are as infectious as those with symptoms. Forty percent of all transmission comes from someone who does not yet feel sick.
A symptom is something that you tell the doctor, like you feel sick. This is different from a sign, which is something your doctor tells you, based on his examination of you. For example, a heart murmur is a sign.
Of those Covid-19 patients with symptoms, 0.4% die. However, it is 1.3% for those over 65 years old and 0.05% (1 in 2,000) for those 49 years old and younger.
But percentages are misleading when the number of patients is huge. If 100 million Americans get infected, which is likely, 0.05% is 50,000 people. That’s almost as many who died in the Vietnam War.
For people who feel sick, 3.4% get hospitalized. It is 7.4% for people over 65 years old. All of these data are based on an average person in an average life situation. If a person has other medical or socioeconomic problems, the math can be much worse.
1st double-blind study on remdesivir has good results
The New England Journal of Medicine published the summary of a double-blind, placebo-controlled study of 1,063 patients. It did not report the data. What they published was preliminary, but they believed it was important enough to report.
As I explained a few weeks ago, a double-blind study is the single most reliable way to evaluate a treatment. Double-blind means that neither the patient nor the doctor knows which patients are receiving the drug and which ones are getting a placebo.
All patients were hospitalized, which means they were very ill. The treatment was for 10 days. I believe that remdesivir is only available as an intravenous medicine.
The study found that remdesivir treated patients recovered in 11 days compared to 15 days for patients receiving the placebo. Patients who needed oxygen appeared to benefit the most.
There are many other studies underway using remdesivir combined with other drugs. Remember, this is a treatment of patients already infected. It has nothing to do with preventing the infection, which is the purpose of a vaccine.
Moderna executives dump stock
An SEC filing showed that Moderna’s CFO and chief medical officer sold $30 million in shares this week as the public was buying the news. Last week, Moderna touted the results of its vaccine trial. This caused a sharp rally. Now we discover that insiders immediately sold.
Is it because they exaggerated the news to pump up the stock price? Were they looking to dump stock at a brief, great price? Too early to tell, but unlikely.
Stock purchases by insiders are more reliable indicators of how well a company will do. You only buy because you believe the stock will go up.
There are many reasons to sell other than believing the stock will collapse. Consequently, it is a mistake to read too much into their stock sale. The SEC will probably investigate.
Since it is too easy to connect the dots, the executives would have to be fools if there were pumping and dumping. I bet they were just buying mansions or paying off a divorce.
Direct contact with an infected person accounts for 99% of infections
Most experts believe that 99% of infections come from being in contact with a contagious person. For example, talking with them or having them cough near you. Furthermore, most of the spread happens indoors.
They are also saying that fomite spread accounts for less than 1% of infections. A fomite is an object that was touched by an infected person, like a door handle.
No one with a microphone cares much about the American people
I am disappointed that so many people are unwilling to do what is right. The media should be talking about the consequences of our decisions. Instead, they are only interested in what took place today or what someone said today.
It is also newsworthy and more important to talk about how long the pandemic will likely last, what the economic consequences will be, and how many people will die. But presumably they are reporting in a way that maximizes their advertising dollars, and I cannot fault them for that.
Likewise, both parties in Washington are more interested in the November election than the lives of the American people. It’s hard to fault them either, given that our Constitution makes that their main responsibility.
I talked about this last week. It is very disappointing that no one with a platform is giving enough of a voice to the American people, who are the victims of the pandemic. Is the news of 100,000 dead Americans getting the attention it deserves? If a car crash kills 6 people, it makes national news. When 2,000 people every day die from this infection, it’s just mentioned in passing.
During the pandemic, it is better to only look ahead
It is in the best interest of Americans to have Washington only think about saving lives and the economy. Once the dangers are behind us, then we need to look back to see what we could have done better. There are going to be other pandemics and we need to do much better the next time around.
Since we are doing much worse than so many countries, it is clear that there are many things we could have done better. But blaming people who are responsible for solving the crisis will only upset and distract them. We need them to be completely focused on solving the many problems. The lack of blaming of one another in Washington is the one thing that both parties are currently doing right.
Columbia University says 54,000 people died needlessly because of our delayed response
I’m not in Washington and therefore do not have political constraints. Also, I am always interested in math. Dr. Fauci a few weeks ago said the obvious, that there would have been fewer deaths had we started social distancing earlier. But just like republican President Trump, democratic New York Mayor Bill de Blasio was opposed to social distancing in February. Both are at fault, and so are many others in both parties.
Columbia University released a study this week that concluded we would have had 54,000 fewer deaths as of May 21 had we began only 2 weeks earlier. 54,000 people died needlessly. It’s incredible that no one cares. Like Stalin said, small numbers are tragic, but big numbers are just statistics.
118 firms making vaccines
The WHO says that 118 firms around the world are working on a vaccine. Each company sees this as their lottery ticket. Who will get a contract to make a billion doses of vaccine?
The important point is that researchers believe that there will be a safe, effective vaccine. While unlikely, maybe dozens of vaccines. The news that Moderna released last week was good but intentionally self-serving and misleading. They spun it in a way to help get a billion dollars in funding.
However, it was useful to hear that their small sample of patients developed antibodies. We don’t know if those antibodies will prevent an infection or if they will last more than a few weeks, but it is clearly better news than hearing them say that no patient developed antibodies after being vaccinated.
Why no vaccine in 2020?
President Trump has said that he is going to make sure that there will be a vaccine before the end of the year. In other words, “I deserve to be re-elected because I am doing it so much faster than what the experts say is possible. Trust me, you will get it right after you re-elect me!”
But will you rush out and get vaccinated. Nope. Why not? Because before you and 7 billion other people get vaccinated, everyone wants to know about long-term complications in addition to immediate side effects.
No one died right after getting vaccinated 6 weeks ago. Good. No significant short-term complications.
But what happens if we discover that 1% of vaccinated patients get Guillain Barre paralysis 6 months out? Or some other nerve degeneration, or aplastic anemia, or a different permanent debilitating side effect? Don’t you want to know that before you have your kids get vaccinated? The CDC is not going to approve of a vaccine until they are certain it is safe.
Why the long wait?
Better safe than sorry. How much time do you need to be confident of no late developing side-effects? One month? For most people, it would be many months, and for some, 6 – 12 months.
We don’t even know if the vaccine will prevent infections. Researches might discover that you need a booster shot 2 months later. All that’s involved with creating a safe and effective vaccine makes it unlikely to have one ready for wide release by December.
We want to see 1,000 people vaccinated and be sure that 90% did not get infected in the next 3 – 6 months. That means we need that to be confident that the vaccine is effective. And we want to make sure that a bunch of them did not die several months out so that we will believe it is safe.
Do the math. No company has begun testing 1,000 patients yet (Phase 3). The testing will take many months. I doubt that any vaccine will be approved this year. While unlikely, it might even take 2 years.
How will that effect the wait affect the economy?
Many people will continue to curtail a lot of activities until there is a safe and effective vaccine. Activities cost money. Restaurants, travel, malls, shows, baseball games, concerts, movies, you name it.
That means reduced consumer spending. This will result in a continuation of the unemployment of many millions of people for the next year, and a lower profitability of American companies.
Less profit, then less E (earnings) in the P/E ratio. Therefore, the P (price) has to get smaller to keep the ratio within its historical range. If the price of stocks has to be less, the stock market will have a difficult time getting far above the current all-time high for at least a year.
The current trading range will then be about 4 years old. Remember, I have been saying since 2017 that the stock market will probably be in a range for about 10 years. This pandemic will get us to about half way there.
Monthly S&P500 Emini futures chart:
Breakout above April high triggered minor buy signal
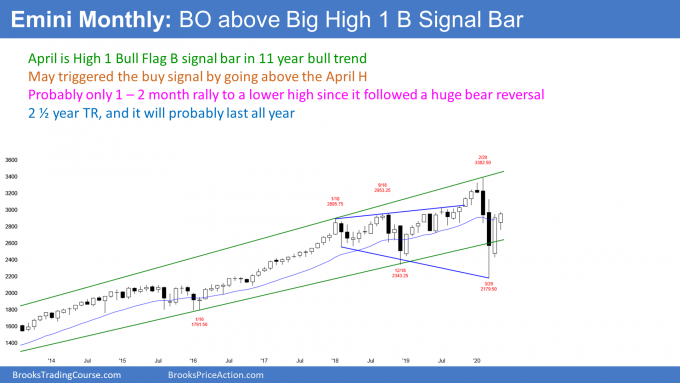
The S&P500 Emini futures market went above the April high, triggering a monthly High 1 bull flag buy signal. The Emini has been in a bull trend for 11 years. As big as the selloff was this year, it was only a 2 bar pullback in a bull trend.
But, when a pullback is surprisingly big like that, traders expect at least a small 2nd leg sideways to down. In 20% of cases, the 2nd leg down begins after a brief new high. Consequently, traders believe that the Emini will turn down for a month or two before making a new high. Therefore, the High 1 is a minor buy signal.
The month ends of Friday. When the range is small like this and there are important magnets nearby, there is an increased chance that the market will get drawn to a magnet at the end of the month. This is especially true in the final hour.
May so far is a bull bar. If it becomes a bigger bull bar, traders will expect at least slightly higher prices in June.
But if May closes below its midpoint or below the April high, traders will look for June to be more sideways. If May closes on its low, June will likely trade at least a little lower.
Weekly S&P500 Emini futures chart:
Reversal from V bottom evolving into trading range
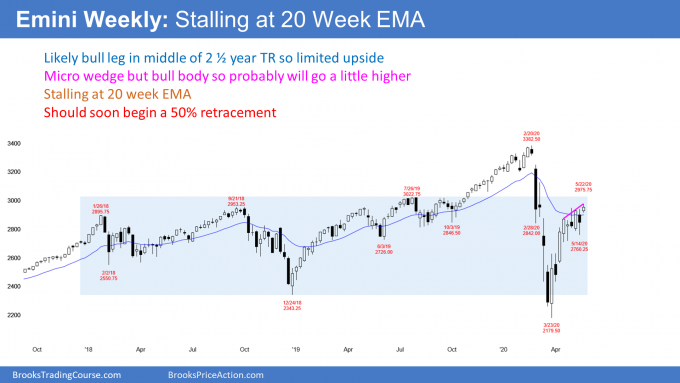
The weekly S&P500 Emini futures chart reversed up in a V bottom from below the bottom of the 2 year trading range. It has stalled at the 20 week EMA.
Furthermore, the price action changed 4 weeks ago when a doji formed. That is a bar with a small body and a big tail. A big tail below means that the market sold off and then rallied. That is two-sided trading.
The significance is that there was a strong enough selloff to create a tail on the bar. A doji is a strong bull trend is an early sign that the strong trend is losing momentum. Traders begin to think about a trading range.
The rally sometimes continues for 5 – 10 more bars before there is a big enough reversal down to begin a trading range. But once it does reverse down, the minimum target is a test of the bottom of the doji.
Sometimes, instead of continuing up, the Emini begins a trading range with that doji bar. That is what has happened in this case. There has only been one big bull trend bar in the past 5 weeks. The other bars have had small bodies and big tails. Also, the bars have mostly overlapped one another.
Rally losing momentum
While there have been a couple new highs since that doji of 5 weeks ago, they have been brief. There can still be another leg up from here without much of a pullback. But if there is, it will probably only last a few weeks. Additionally, it will likely be only a bull leg in a trading range that began with that doji 4 weeks ago.
Micro wedge increases chance of pullback
This week is the 3rd high in the past 6 weeks. There is now a micro wedge on the weekly chart. This week is the sell signal bar. But this week had a bull body. It is therefore a weak sell signal bar. Traders expect that there will be buyers below this week’s low.
The one caveat is that Friday is also the end of the month. If there is a strong reversal down by the end of the week, there will be a sell signal bar on the monthly chart. That would erase the bullishness of this week’s bull close.
It is important to note that the 2 month bull channel is tight. Consequently, if there is a reversal down in June, it should be minor in the sense that it will probably not fall below the March low. Traders will look for a couple legs down for a month or two and expect a higher low.
A selloff often retraces about half of the rally. Therefore, the Emini will probably fall to 2,600 – 2,700 in June. But, as I said, traders will buy the selloff. They expect at least a small 2nd leg up after a 35% rally in 2 months.
Daily S&P500 Emini futures chart:
Sell zone between 3,000 and 3,100
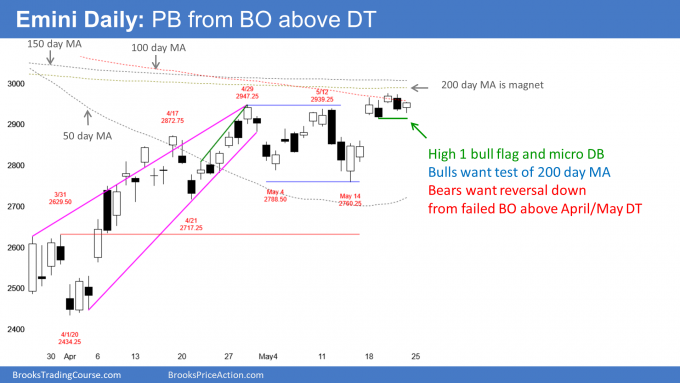
The daily S&P500 Emini futures chart broke above the April wedge top this week. When there is a breakout above a top, in general, there is a 50% chance of a trend up and a 50% chance of a failed breakout and another attempt at a top.
But the probability for the bulls is higher here. There are magnets above, the bull trend is strong, and Friday closed near its high. Traders expect next week to go at least a little higher. The 200 day moving average is the minimum goal.
The Emini spent the week oscillating around the April high. When May went above the April high, the Emini triggered a buy signal on the monthly chart.
Traders are deciding if the breakout above the April high will succeed or fail. If May closes far above the April high, traders will expect higher prices in June. They will expect sideways to down trading in June if May closes around or below the April high.
If there is a trend up, traders will look for a measured move up based on the height of the month-long trading range. The target would be just above the March 3 lower high.
That March 3 lower high is very important. It was the end of the 1st pullback after the February collapse. That makes it the start of the March parabolic wedge sell climax.
A reversal up typically tests the start of the last leg down
When the Emini reverses up from a Spike and Wedge Bear Channel like this, the rally typically works it way to the start of the channel. At that point, traders expect the bull trend to evolve into a trading range.
So the measured move target based on the 3 week double bottom is at a very important price. Also, the rally is extreme. Yet, it followed a huge bear trend. There will probably be a 2nd leg sideways to down. A test of the March 3 high would be a good location for the start of that 2nd leg down.
The Sell Zone is between 3,000 and 3,100
The rally does not have to make it all the way to the March 3 high before exhausting itself. It is near enough now for traders to see it as a satisfactory test. They would be more convinced that the bulls have exhausted themselves if the rally was closer to the March 31 high.
However, the Emini could still begin a 50% selloff from this week’s high or just a little higher. The 200 day simple moving average is an important magnet and it is only about 15 points above this week’s high.
The Emini will probably have to get there before it reverses down. So the sell zone is between the 200 day moving average, around 3,000, and the March 3 high, around 3,100. Bulls will take profits there and the bears will begin to short.
It is important to note that the March collapse was 35% and the May rally is now 35% above the March low. Markets like symmetry, and this is another factor that works against the bulls near-term.
Bear legs in trading ranges typically fill gaps
I said that a 10% correction is a reasonable goal for the bears. However, the Emini has been in a trading range for 2 1/2 years. Selloffs typically fall below breakout points.
The April rally broke strongly above the March 31 high. That high is therefore the breakout point. There is a gap above that high and below the April 21 pullback. Gaps in trading ranges usually get filled.
At some point this year, the Emini should fall below that high of 2629.50. Since that is near the 2600 Big Round Number, traders should expect a test of 2,600 this year. It could come in the next couple months.
What will the borders of the upcoming trading range be?
The top of the range for the remainder of the year will probably be around the March 3 high. That was the start of the parabolic wedge sell climax. The start of the climax usually gets tested and then there is typically a leg down.
There are a couple other important prices that I have not mentioned in a few weeks. When the Emini fell 10% from the high, it entered a correction. That price is 3,054.38, which is in my 3,000 – 3,100 sell zone.
When the Emini fell 20%, it entered a bear market. That is 2706.00. There is a 70% chance that the Emini will test below that level before the end of the year. When it does, the news will be that the stock market is back in a bear market. As I said many times, I think it will fall below the March 31 high of 2629.50 because that is a breakout point.
Therefore, a rough guide of where the Emini will probably be for the rest of the year is between 10 and 20% down from the high. That is approximately between 2,600 and 3,100. Traders will likely look to buy when its around 2700 and sell when it is above 3,000 to around 3,100.
Trading Room
Traders can see the end of the day bar-by-bar price action report by signing up for free at BrooksPriceAction.com. I talk about the detailed Emini price action real-time throughout the day in the BrooksPriceAction.com trading room. We offer a 2 day free trial.
Charts use Pacific Standard Time
When I mention time, it is USA Pacific Standard Time (the Emini day session opens at 6:30 am PST, and closes at 1:15 pm PST). You can read background information on the intraday market reports on the Market Update page.

