Market Overview: Weekend Market Update
All major indices are now in bear markets. But, the Emini started to reverse up from a parabolic wedge sell climax on Friday. There will probably be a strong short covering rally for the next 2 weeks.
The bond futures market has had the most extreme buy climax in its history. This week’s reversal down will probably be the start of a few weeks of sideways to down trading.
The EURUSD Forex market broke strongly above its 18 month bear trend line. The 2 year bear trend is probably over. This week’s strong bear reversal will probably lead to a 1 – 2 week pullback.
30 year Treasury bond Futures market:
Huge buy climax so expect pause in bull trend
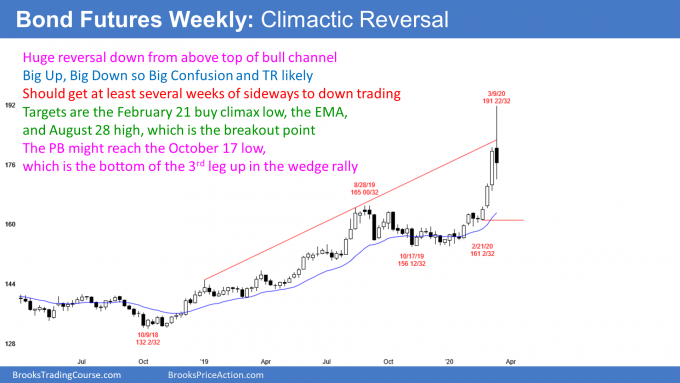
The 30 year Treasury bond futures market had a huge rally over the past 3 months on the weekly chart. It was especially dramatic over the past 4 weeks.
Bond futures reversed down strongly from above the top of its bull channel. The selloff should test the February 21 low within a few weeks. It might reach the October 17 low within a couple months.
When a buy climax reverses down, the bottom of the most recent buy climax and of the most recent leg up are magnets. The selloff typically has at least a couple legs sideways to down. It should then evolve into a trading range for several weeks.
When the biggest breakout in a bull trend comes late in a bull trend, there is a 60% chance that the bull trend will pause at that point or after one more brief push. Additionally, there is a 60% chance that there will be one more push up. However, this week’s reversal was so extreme that, if there is one more push up, it will probably make a lower high.
A buy climax leads to a pause in the bull trend and not necessarily to a trend reversal
It is important to note that I did not say that the climactic reversal down would lead to a bear trend. There is a 40% chance that it will after several months. But there is a 60% chance of the bond market going sideways for a month or more. A trading range is more likely than a bear trend or an immediate resumption of the bull trend.
After there are a couple legs sideways to down, the bulls will consider buying again. They will need to see signs that the bears are unable to continue the reversal down into a bear trend.
If the trading range lasts 10 or more bars, the bears would then have a better chance of reversing the bull trend into a bear trend. They typically need to stop the bull trend for many bars before traders will be willing to short and hold shorts for a swing down.
Targets for the bears
If the bears get a swing down, an important target is the bottom of the most recent buy climax. That is the low of 4 weeks ago. The 20 week EMA and the August high are magnets as well.
The 3 weeks before this week’s reversal were in a breakout. They broke above the old high, which is the August high. It is therefore the breakout point. After a breakout, there typically is an eventual pullback to the breakout point. Traders want to see if the bulls will again buy at that price. If enough do, the bull trend will resume.
After Big Up, Big Down, there is Big Confusion
This week’s selloff was big, while not as big as the 3 week rally. However, it was big enough to generate confusion. Traders are wondering how long the sideways to down trading will last and how far it will go. They typically need many weeks before they can draw a conclusion.
In the meantime, they are uncertain. When traders are uncertain, they are unwilling to hold onto positions very long. Additionally, they prefer to buy low and sell high. The result is a trading range, and that is what traders should expect over the next month.
When the market is in a trading range, there are usually more traders looking to buy below bars and sell above bars. They bet on reversals instead of trends. Consequently, even though this week is a sell signal bar, the reversal down will probably be minor. That means traders expect that the 1st leg down will lead to a trading range and not a bear trend.
EURUSD weekly Forex chart:
Pullback from extreme buy climax
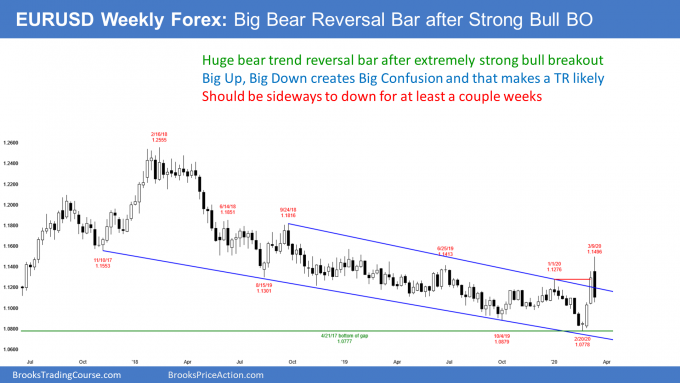
The EURUSD weekly Forex chart this week formed a big bear reversal bar after 2 huge bull bars. The rally was the strongest in 2 years. It broke far above the 18 month bear trend line and above the January major lower high. Traders are concluding that the 2 year bear trend has ended.
The end of a bear trend means either the start of a bull trend or of a trading range. A trading range is more common. This week’s big bear bar increases the chance of a trading range for at least a few weeks. Big Up, Big Down means Big Confusion. Confused traders are quick to exit positions. This limits the movement up and down and typically creates a trading range.
2nd leg up likely after 1st pullback
Whether this is the start of a bull trend or just a strong bull leg in what will be a trading range, the rally was strong enough so that traders will expect at least a small 2nd leg sideways to up.
However, it was so extreme that the bulls are exhausted. Exhausted bulls typically take at least partial profits. They usually do not look to buy again just a few bars later. If that was their plan, they would hold long.
They know many bulls will take profits and bears will begin to sell. The bulls typically give the bears at least a couple chances to create a bear trend. After 2 legs sideways to down, the bulls will decide if the bears are failing. If they see a good buy setup, they will buy again, looking for a resumption of the bull trend.
On the other hand, if the selling keeps drifting down for 10 or more bars, the bulls will continue to wait. If the selloff lasts a month or more and retraces 60% or more of the rally, traders will conclude that the bull breakout was the start of a trading range and not a bull trend.
What about next week on the daily chart?
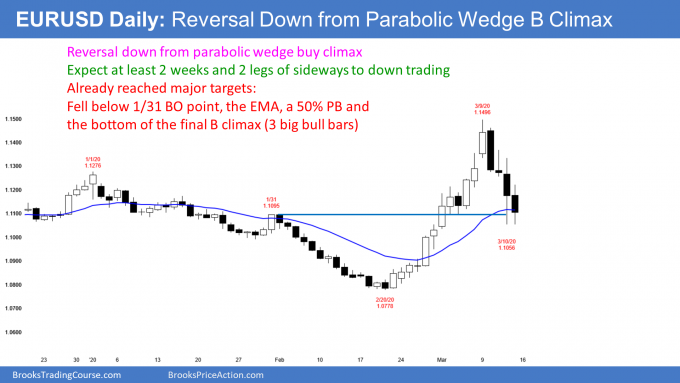
This week’s reversal down was big enough to make traders think that significant profit taking has begun. They therefore expect a couple legs sideways to down over the next couple of weeks.
The 1st target is the bottom of the most recent buy climax. On the daily chart, that is the low of last week’s 3 big bull bars. That is around the January high, which is a breakout point and therefore a magnet. Additionally, it is around the magnet of the 20 day EMA. Another common target is a 50% pullback. Thursday’s selloff reached all of those targets.
Some bulls will buy above the high of the previous bar on the daily chart, hoping that the bull trend will quickly resume. After 4 consecutive bear bars, there will probably be more sellers than buyers above bars for at least a couple weeks. The bulls will have a higher probability of making money if they wait to buy until the EURUSD has couple legs sideways to down and begins to form bull bars.
Monthly S&P500 Emini futures chart:
Consecutive big bear bars but still in 2 year trading range
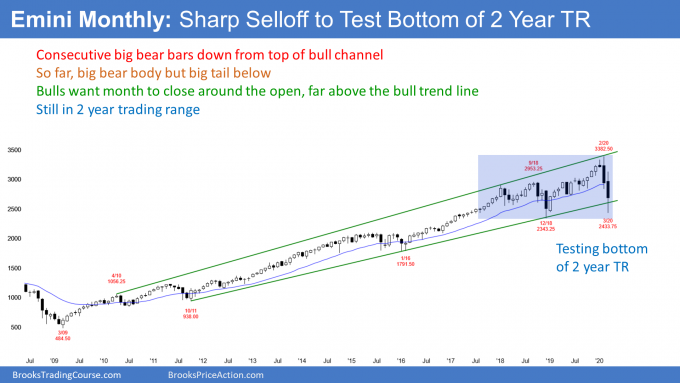
Until February, the monthly S&P500 Emini futures chart was in a strong bull trend since 2009. I have made the point many times that the buy climax at the end of 2017 was the most extreme in history. This was true on the daily, weekly, and monthly charts. There was likely to be a pause and then one more leg up before a bigger pullback.
That is what happened. Last year was a 2nd buy climax after 2 sideways years. The stock market reversed down violently over the past 2 months on the monthly chart.
But 2 down months do not make a bear trend. It is more likely that the selloff on the monthly chart will be a bear leg in what will become a trading range for several months. However, the odds favor a bear trend on the monthly chart whether or not there is a trading range for several months first.
There is support at the December 2018 sell climax low. This initial selling might have stopped this week around that low. The big tail on the bottom of the March candlestick is a sign of strong buying.
Possible head and shoulders top later this year
If there is a bounce that lasts several months and then another reversal down, traders will wonder if the 2 year trading range is a head and shoulders top. If the bears get a lower high with good sell signal bar, there would be a 40% chance of a bear trend.
While any one signal has a 40% chance of leading to a bear trend, there is a 50% chance of a bear trend beginning on the monthly chart within the next 12 months.
The obvious bear target would be a measured move down based on the height of the 2 year trading range. Remember, there might be a head and shoulders top if there is several months of sideways trading. That measured move would be around the bottom of the 2014-2015 trading range, which would be about a 40% correction.
Sideways for the next decade
I said in late 2017 that there would be a top within 5 years that would lead to a couple 40 – 50% corrections over the next decade. The February high could be that top. But, the monthly chart might go sideways for a year or more before there is a strong 2nd leg down.
I also said that the stock market will probably be in a big trading range for the next decade. This is true even if there are one or more brief new highs during the decade.
Traders should still expect this because this is what typically happens after an extreme buy climax. Price gets far ahead of the fundamentals and it takes about a decade for the fundamentals to catch up. This happened in the 1970’s and the 2000’s.
Can this selloff be a bear trap?
Can this selloff simply be a sharp pullback in a 12 year bull trend? A bear trap? The bulls have a 30% chance of that. After consecutive buy climaxes (2017 and 2019) in the most overbought market in history, there is a 70% chance of at least 2 legs sideways to down.
The 2 month selloff is forming the 1st leg down. Traders are deciding where this 1st leg down will end. It could end at any time. It might have ended this week.
But even if there is a strong reversal up over the next couple of months, the odds would still favor a 2nd leg sideways to down after that rally. Traders should assume that the best that the bulls will get over the next couple months is a bounce in a trading range and not a resumption of the bull trend.
Weekly S&P500 Emini futures chart:
Strong selloff testing the bottom of last year’s trading range
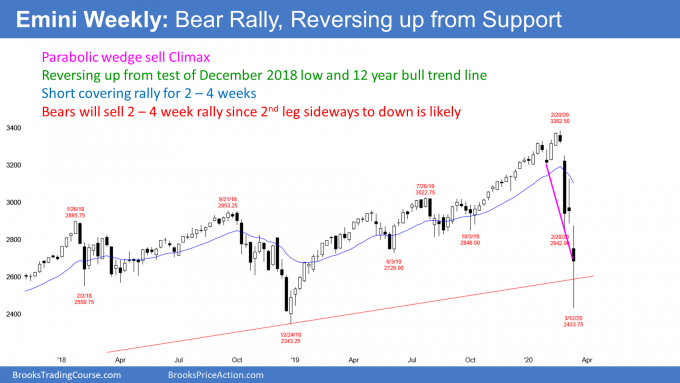
The weekly S&P500 Emini futures chart sold off strongly over the past 3 weeks. It broke below the 12 year bull trend line, but held above the December 2018 bottom of the 2 year trading range. The strong, late buying on Friday lifted the week’s close above the bull trend line and back to the middle of the week’s range.
Can the selloff continue straight down to below the December 2018 low of 2343.25? There is a 40% chance at this point that the collapse will reach that target before there is at least a 2 week bear rally.
The selloff has been exceptionally extreme. Many bears will be eager to take some of their exceptional profits soon. Additionally, a reversal up could be violent. It might have begun in the final 30 minutes on Friday.
We are getting near the end of the quarter. The last 2 weeks of March have a bullish bias. That is another factor that could contribute to a sharp short covering rally soon.
Daily S&P500 Emini futures chart:
Reversing up from parabolic wedge sell climax
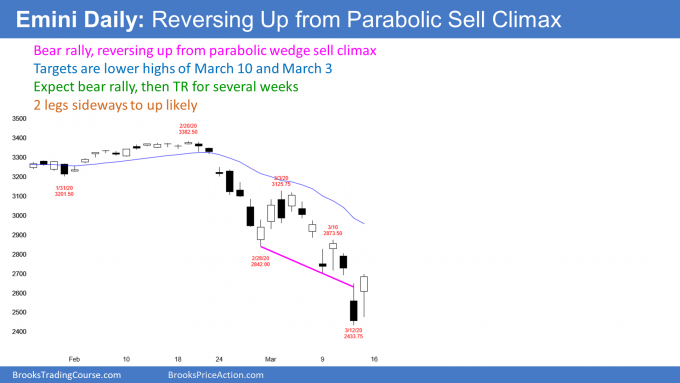
The daily S&P500 Emini chart is in a bear trend. A bear trend refers to the behavior of the chart.
Once a selloff reaches 20%, there is a bear market in addition to a bear trend. The S&P cash index, the Dow, and the Nasdaq all closed 20% below their all-time highest closes this week. They are also in bear trends on the daily and weekly charts.
When there is a bear market, the final low is typically much lower than 20% The median selloff is 28% and it lasts 13 months. It then takes 21.9 months on average to make a new high. My shorthand way to think about this is that I expect a bear market to fall about 30% over a year and take 2 more years to make a new high.
There is lots of variability. Some bear trends end much sooner and barely fall more than 20%. Others last for years and fall more than 50%. It is too early to know what will happen this time.
But this selloff has been unusually severe. Also, the selloff followed extreme buy climaxes in 2017 and 2019. The one in 2017 was the most extreme in the history of the stock market. Furthermore, this was the longest bull trend in history. Traders should expect this bear market to fall more and last longer than average.
The Emini has already fallen 28%
This week’s low in the Emini was 28% below the all-time high. Also, the S&P500 cash index closed 27% down from its highest close on Thursday. Both have fallen as much as the average bear market.
It is important to note that Friday’s late rally put the close of the cash index at 2711.02. Why is that important? Because a 20% correction down from the highest close is 2708.92. That defines a bear market.
One of the goals of the bulls who created that huge 175 point rally in the final half hour on Friday was to get today’s close back above the 20% correction level. The bulls succeeded by 2 points!
Therefore, the bears only got one daily close below the magic price and they failed to get a weekly close below that price. Their case would have been stronger if they got consecutive daily closes below and a weekly close below. That is a sign that the bulls might be retaking control, at least temporarily. It increases the chance of a strong rally over the next 2 weeks.
Remember that bear trends typically have at least a small 2nd leg down after the 1st strong reversal up. Consequently, this week’s low will probably not remain as the bottom of the bear trend. The odds are that the final low be lower. That means the correction will be at least 30% down from the high. There is a 40% chance that it will be around 40% down.
Strong bear rally likely after parabolic wedge sell climax
As strong as the selloff was, there were 3 legs down in a tight bear channel. The 3rd leg down broke far below the trend channel line drawn across the bottoms of the 1st 2 legs. That is a parabolic wedge sell climax. When it is extreme, it usually attracts profit taking by the bears.
Also, many bull traders will buy, expecting a strong short covering rally. I mentioned in the chat room on Friday that I bought SPY calls near the bottom of the morning selloff.
Everything will go up in a bear rally
It is important to note that all sectors sold off. They therefore will probably all rally. It is likely that value hunters will be buying just about everything for a trade up for a couple weeks.
The bears will be frantically buying back their shorts once they see the market not continuing down. But, after a couple legs up, they will look to sell again. They know the odds are that there will be a 2nd leg down after such an extreme selloff.
The short covering rally after a wedge bottom typically has at least 2 legs sideways to up. It usually stalls at the top of the pullback from the 2nd leg down. That is the March 10 high of 2873.50.
While that can be the end of the rally, it more often continues up to the start of the wedge bear channel. That is the March 3 high of 3125.75.
At the close of Friday, there was a 60% chance that the rally has begun. If Monday or Tuesday is a big bull day, there will be a 70% chance of a strong short covering rally.
Can the market continue to collapse? Unlikely. There is a 30% chance that the selloff will continue down to below the December 2018 low before there is more than a 3 day bounce.
75% chance of recession
There have been unusually extreme buy climaxes on the daily, weekly, and monthly charts over the past 2 years. These patterns have led to write over the past several months that there was a 75% chance of a recession in 2020.
Rarely is anything that certain in the financial world. However, many business are greatly reducing their services. Travel is the most obvious example. Also, when the value of stocks fall this much, wealth is lost and consumption goes down. That ripples through the economy and causes layoffs and a further reduction in consumption. I now believe that the odds of a recession are at least 75%. I suspect closer to 100%.
Coronavirus is not the problem
The media are blaming coronavirus, but that is because they are in the news business. They believe that everything important is caused by something in the news. The sun revolves around them. They are the center of the universe.
If this bear trend is due to coronavirus, why is it that 2 years ago, I repeatedly said that the Emini would enter a 10 year trading range within a few years? I said that because the 2017 buy climax was the most extreme in history. It was strong enough to have at least a small 2nd leg up, but it was likely to be the start of a major top. The 2019 buy climax completed that top.
Therefore, you can think of the past 2 years as investors building a bomb in the market. Coronavirus hit the switch and it blew everything up. But it was going to blow up anyway. If there was no pandemic, some other black swan would have come along and triggered the explosion.
Most extreme buy climax in history
As I mentioned above, I said 2 years ago that the market was forming the most extreme buy climax in history. Furthermore, I repeatedly compared it to the rallies in the 1960’s and late 1990’s. Also, I said that both led to trading ranges over the next 10 years and traders should expect the same this time.
In a couple years, coronavirus will no longer be in the news. So why won’t the bull trend resume? Why not in 5 years? Is it still coronavirus? Of course not. Extreme buy climaxes need a long time to resolve. It will probably take about a decade.
In a couple years, you will no longer hear about coronavirus on the business news stations. If the market is still sideways to down, you instead will hear about how the stock market was not generating the earnings that traders expected in 2019 and 2020. You will also hear that the market was propped up by the Fed and incredible borrowing. In fact, those are the real reasons for this bear market. I suspect that it will much longer than a few years for them to go away. They will be here long after coronavirus is gone, and therefore coronavirus was the temporary excuse, but not the underlying long-term problem.
Is this a secular or cyclical bear market?
These are other terms that you will sometimes hear. The simplest distinction is that a cyclical bear trend is shorter term, lasting one to 3 years. It is a pullback in a secular trend.
A secular trend lasts many years or even a decade. It typically contains one or more cyclical trends up and down within it, but the underlying force behind the secular trend remains intact.
When a selloff falls about 20% and lasts about a year, traders call it a cyclical bear market. The implication is that it is just a protracted pullback in a much bigger bull trend.
If the market falls 40%, traders will start to refer to the selloff as a secular bear trend or market. Remember, “trend” refers to the chart pattern and bear “market” refers to a loss of more than 20% from the all-time high. When there is s bear market, the daily chart is usually in a bear trend.
In a secular bear market, there are cyclical bull trends. Their average gain is about 65%, but they end in about 18 months, and then there is another swing down.
Since I believe that the market will be sideways for about a decade, the 12 year secular bull market is probably ending. If the market goes sideways for a few years, traders will begin to refer to it as being a secular bear market. They will then assume that any rally will fail to get much above the old high.
World economic forces might be turning bearish
The charts are indicating that the world’s economic forces are transitioning into a bearish mode from the bullish mode of the past 12 years. This is impossible to know for certain for at least a few years, but that is what happened in the 1970’s and the 2000’s. Both decade-long trading ranges followed huge bull trends. Price got far ahead of the fundamentals. It took about a decade for the fundamentals to catch up.
There has been a secular bull trend since 2009. If there now a secular bear market, the bearish forces will probably control the market for about a decade. Those forces will eventually overwhelm every 1 – 2 year strong rally.
While there might be one or more brief new highs over the coming decade, if this is in fact a secular bear trend, the market will probably be unable to go far above prior highs. Furthermore, it will probably fail to stay above for very long.
Great buying opportunity for retirement Account? NO!
A friend of mine told me he sees this selloff as another great buying opportunity for his retirement account, just like every other selloff for the past 12 years. He said he bought last week when the market was 10% down. I told him that I have been saying that every selloff for the past 12 years was minor. So yes, even a 10% reversal was likely to resume up to a new high. The market was in a secular bull trend. Every selloff was a buy because a new high was likely.
But the market is now a bear market. And it might become a secular bear trend. This is different from everything that has taken place for 12 years. You cannot trade it the way you have been trading. This is not the time to buy unless you are a trader looking for occasional bear rallies. Even then, you will lose money if you do not know how to manage your trades.
Even if this turns out to be a routine bear market (cyclical bear), the low is still likely to be many months to a year away. There is no need for investors to buy now. They might be able to buy lower in about a year.
Also, it typically takes about a year before there is a test of the high after a bear market begins. Consequently, there is no rush to buy.
Finally, if I am right and the market will be in a trading range for 10 years, investors will be frustrated by their lack of returns. Traders waiting to buy 30 – 50% pullbacks and then taking profits on rallies of about 50% will probably do better than buy and hold investors over the next decade.
What to expect next week
The daily chart has had 3 legs down in a tight bear channel. This is a parabolic wedge selloff. That typically attracts profit takers, especially when the selloff has been extreme and especially when it is near major support. The December 2018 low and the 11 year bull trend line are major support. Consequently, traders are looking for a 1 – 2 week bear rally to start within a week or so.
It might have begun with the very strong rally in the final 30 minutes of trading on Friday. If there is a gap up on Monday, there would be a 2 day island bottom. That would increase the chance of a strong bear rally.
Trading Room
Traders can see the end of the day bar-by-bar price action report by signing up for free at BrooksPriceAction.com. I talk about the detailed Emini price action real-time throughout the day in the BrooksPriceAction.com trading room. We offer a 2 day free trial.
Charts use Pacific Standard Time
When I mention time, it is USA Pacific Standard Time (the Emini day session opens at 6:30 am PST, and closes at 1:15 pm PST). You can read background information on the intraday market reports on the Market Update page.

