Market Overview: Weekend Market Analysis
The SP500 Emini strong bull trend is still under the influence of that streak of 13 consecutive bull bar that ended 2 weeks ago. It should attract profit takers, and this therefore will likely limit the near-term upside from here. Traders should expect the buy climax to soon evolve into a trading range, which could last a couple months.
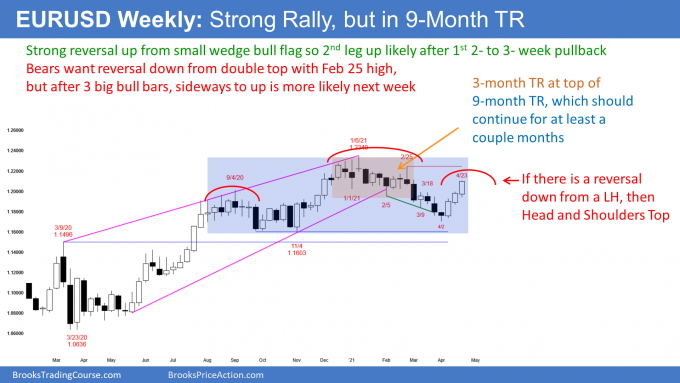
The EURUSD Forex market is in the middle of a 9-month trading range. This should continue for at least a couple more months. As strong as the 3-week rally has been, as long as there are not a couple closes above the trading range, traders will continue to look for reversals every few weeks. While the 3-week rally make at least slightly higher prices likely next week, the EURUSD will probably soon go sideways to down for a couple weeks.
EURUSD Forex market
The EURUSD weekly chart

- The EURUSD Forex market has been in a trading range for 9 months. Within that range, there was a lower range from August through October, an upper range from November through February, a bear breakout in March, and a reversal up in April.
- The April rally is in the middle of the 9-month range, but this week strongly broke back above January 1, which is the approximate bottom of the November to February range.
- The bulls want the rally to continue up to above the top of that range (the January 6 high).
- The 3 big bull bars closing on their highs make at least slightly higher prices likely next week.
- This rally will probably stall in the November to February range, despite the 3 big bull bars closing on their highs.
- However, the rally is strong enough to expect sideways to up trading, for at least a couple more weeks.
- The bears hope that the 3-week rally is just a bull leg in the bear channel that began on January 6. They want a lower high, a break below the November 4 low at 1.16, and a measured move down to the March 2000 low at 1.06.
- If the bears get a reversal within the next few weeks, there would be a lower high major trend reversal. There would also be a head and shoulders top.
- Even a good looking top would only have a 40% chance of a reversal down into a bear trend.
- The bears would probably need a few sideways weeks before there could be a credible top.
- Most major reversals end up being minor, like a leg in a trading range. It is more likely that a selloff will just end up as a bear leg in the 9-month trading range.
- After 3 consecutive big bulls bull bars, the bears will need a micro double top before they can get more than a couple bars sideways to down.
- After 3 consecutive bull bars, the reversal will probably be minor. That means a couple weeks, and then another attempt back up.
- The most important point is that the weekly chart has been in a trading range for 9 months. The 3 big bull bars are not enough to make traders conclude that the trading range has ended, and the bull trend has resumed.
- Unless the bull get a couple closes above the January 6 high at the top of the range, traders will expect the trading range to last at least a couple more months.
S&P500 Emini futures
The Weekly S&P500 Emini futures chart

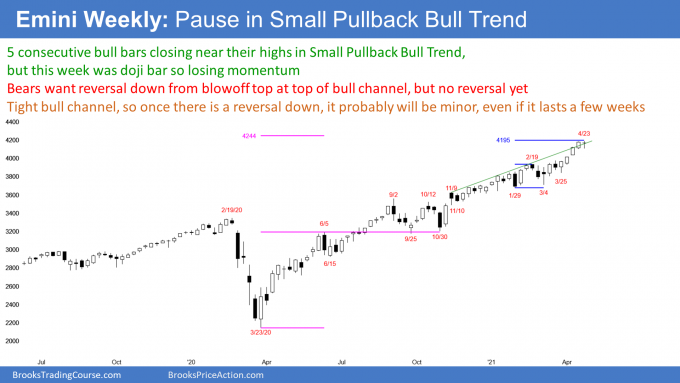
- This week was a bull doji bar after 4 consecutive big bull bars closing on their highs. It was created by some profit taking, and therefore a pause in an Emini strong bull trend.
- With this week closing near the high of the week, and making a new high on Friday, Monday might gap up. That would create a gap on the daily and weekly charts.
- As climactic as the rally is, there is no sign of a top. Traders expect higher prices on Monday.
- There is an important measured move target at 4244. The September 25/October 30 double bottom was a breakout test of the June 5 high. That high is therefore important. The pandemic low is important. Two important prices often create a 3rd important price, which is a measured move target.
- Next week is the final week of the month. There is an increased chance of a big move up or down at the end of the week.
- Traders often change the appearance of a bar just before it closes. The bar on the monthly chart closes on Friday.
- The bears hope that the 5 bull bars will be an exhaustive buy climax, and a failed breakout above the 6-month tight bull channel. They want this to be the end of the bull trend, and the start of a retracement of half of the yearlong rally.
- If next week begins a reversal down, the 1st target is the bottom of the most recent buy climax. That is the low of the 5 consecutive bull bars, which is at the 3,843.25 March 25 low.
- 5 consecutive big bull bars can be a blow-off top, and the end of a bull trend. But because they are coming within a tight bull channel (a Small Pullback Bull Trend) instead of from a breakout of a trading range (like a Final Bull Flag), the 1st reversal down will probably be minor.
- A minor reversal in a Small Pullback Bull Trend is typically 1- to 3-bars sideways to down. Sometimes the pullback can go sideways for 10 or more bars before the bulls buy again. That happened in September and October last year.
- Again, after 5 weeks closing on their highs, traders expect at least slightly higher prices.
Can this be an inverted V-top?
- Can a reversal go straight down over the next few weeks to the March 25 low, or even to a 50% retracement of the yearlong rally, which is around the October 30 low at 3,200?
- The high would be an inverted V-top, which is rare and therefore unlikely.
- The 1st reversal down should be minor. A minor reversal only has a 30% chance of growing into a bear trend without first forming a major trend reversal.
- Therefore, if this week or next week is the high for the year and the start of a bear trend, the bears will probably need a lower high major trend reversal before traders see the selloff as a bear trend.
- To get a lower high major trend reversal, the bears will need a selloff of at least several weeks, and then a rally to a lower high over the course of at least several more weeks.
- Since that process typically would require a couple months or more, the downside risk is small in May.
- Traders expect about a 10% correction at some point this summer. The September and October selloffs last year were each about 10%.
- Because this buy climax is so extreme, there is a 40% chance that the 1st reversal down could reach 20%.
- Most likely, the 1st reversal down will only last 2 to 3 weeks. The bears will probably need at least a micro double top before they can get a reversal down to the March 25 low.
- However, because the buy climax is so extreme, the selloff could lead to a trading range for a couple months, before the bull trend resumes.
The Daily S&P500 Emini futures chart

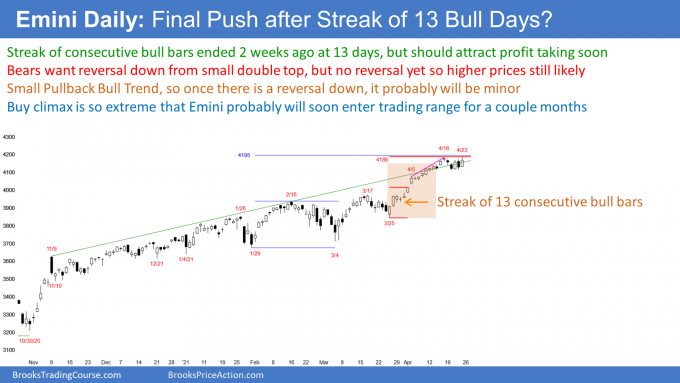
- In Emini strong bull trend but now sideways for 2 weeks.
- The bulls see the tight trading range as a bull flag. Since strong bull trend, at least slightly higher prices likely.
- The bears want a reversal down from a double top, but need a bear sell signal bar next week.
April streak of 13 consecutive bull bars is a problem
- The dominant feature is the streak of 13 consecutive bull bars that ended on April 13.
- That was the longest streak since the 15-day streak in 2011. Back then, the Emini fell 9% over the following few weeks. There was then a minor new high, and that led to a 24% reversal down into October. I posted the chart last week.
- I have said that this time will do something different. For example, the 15-bar streak immediately led to a 9% selloff. This time, the Emini strong bull trend has already gone above the high of the streak and to a new all-time high.
Features of buy climaxes
- Buy climaxes share some features.
- The most important is that a buy climax can continue much longer than what seems reasonable.
- Traders are not confident that a correction is underway until it is half over.
- In general, the more extreme the buy climax, the more prolonged and deeper the correction.
- In terms of a streak of bull bars, this is the most extreme buy climax in 10 years. I wrote about blow-off tops last week.
- While there might be a couple more brief new highs over the summer, the Emini will have a difficult time creating a sustained move far above the April high.
- A buy climax usually leads to a trading range.
- Once the bull trend evolves into a trading range, the bears have a 40% chance of a reversal down into a bear trend.
What are the downside targets?
- The Emini stalled for a week or more at all of the Big Round Numbers from 3,500 to 3,900.
- It broke far above the biggest round number (4,000), without any hesitation, and it never pulled back to test it.
- Once there is a reversal, the 4,000 Big Round Number is a strong magnet below.
- There is also a gap on the daily, weekly, and monthly charts from when April 1st gapped above the March 31st high of 3,983.75, which was the high of March (and an all-time high).
- On the daily chart, there is a big gap above the April 1 high of 4015.50, which is an important magnet.
- The bottom of the streak of 13 consecutive bull bars is a magnet. That is the March 25 low of 3843.25.
- Traders look to buy at 2%, 5%, 10% and 20% down from the high, so those are magnets below.
Last week of the month
- Next week is the final week of the month. Any time frame often has a surprisingly big move before a bar closes, which can alter the appearance of the bar. This month so far is a big bull bar closing near its high.
- The bulls want April to close near its high. That would increase the chance of higher prices in May.
- If April closes on the low, traders would expect lower prices in May. April has only a 20% chance of closing on the low of the month.
- April will probably close near the high, or at least in the upper half of its range. The more it closes on its high, the more likely May will trade higher.
- If April sells off next week and closes somewhere in the middle of its range, there would be confusion. That would reduce the chance of a big move up or down in May.
- At the start of March, I wrote that March/April was the most bullish pair of consecutive months of the year.
- Traders often say, “Sell in May and go away.” That is because a strong March and April increases the chance of a pullback into the 4th of July.
- I do not trade calendar tendencies because the Trader’s Equation for calendar trades is weak.
- However, with an extreme buy climax in March and April, there is less chance of a strong rally in May. In fact, many bulls will use the rally to take some profits. This makes it likely that the Emini will soon enter a trading range for a couple months.
FOMC announcement on Wednesday
- There is an FOMC announcement on Wednesday.
- Fed Chairman Powell has said that he will not raise short-term rates for a couple of years.
- Remember, he can only change short-term rates.
- He has no control over long-term rates, which are determined by the market.
- It is foolish to believe that every variable he is considering will stay neutral for 2 years, and it is therefore foolish to believe him.
- I believe it is intent at the moment to not raise short-term rates, and it is his hope that long-term rates will not go up much.
- Traders know that a major natural disaster or manmade catastrophe, like a war, anywhere in the world can make long-term rates soar, no matter what Powell says.
- A much faster rise in rates and in inflation would force Powell to raise short-term rates.
- The odds are that nothing significant will happen before 11 am PT on Wednesday when the Fed makes its announcement, and that therefore Powell will not surprise the market.
- However, changing a single word in the statement could be enough to begin a move up or down in the market that could last for weeks.
Trading Room
Traders can see the end of the day bar-by-bar price action report by signing up for free at BrooksPriceAction.com. I talk about the detailed Emini price action real-time throughout the day in the BrooksPriceAction.com trading room. We offer a 2 day free trial.
Charts use Pacific Time
When I mention time, it is USA Pacific Time (the Emini day session opens at 6:30 am PT, and closes at 1:15 pm PT). You can read background information on the intraday market reports on the Market Update page.

