Market Overview: Weekend Market Analysis
The SP500 Emini futures traded below October low and reversed sharply higher closing above last week’s close on the weekly chart, a strong bull reversal bar. Monday is the last trading day of the month. Bulls want a strong close above the middle of the monthly candlestick around 4500. Bears want the month to close near the low to increase the odds of February trading at least slightly lower. The 4-week selloff is strong enough for traders to expect at least a small sideways to down leg after a pullback (bounce). Less likely, we will get a small pullback trend that goes all the way up to the trend extreme.
The EURUSD Forex market had a strong breakout below the 7-week tight trading range this week. The 9-week sideways to up trading relieved some of the prior oversold condition, and bears are now more confident about selling again. The bulls want the 7-week tight trading range to be the final bear flag of the bear leg. However, the bulls will need to do more by creating consecutive bull bars closing near their highs to convince traders that the breakout below the tight trading range will fail.
S&P500 Emini futures
The Monthly Emini chart
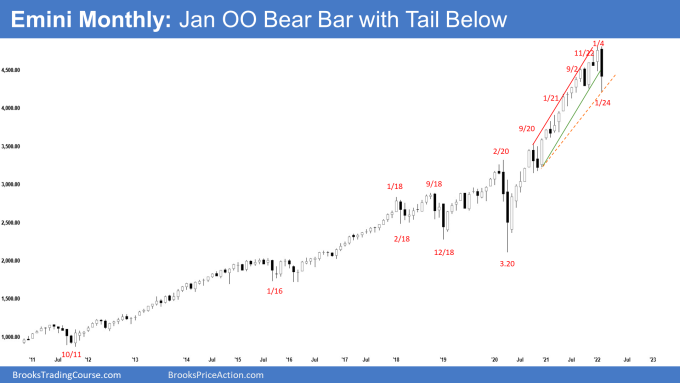
- The January monthly Emini candlestick currently is an outside down bar after an outside up December. This is an OO (outside-outside) pattern, which means Breakout Mode. January is both a buy and a sell signal bar.
- The Emini tested the bottom of the 6-month trading range but reversed back higher. There is a prominent tail below the candlestick which means the bears are not as strong as they would like to be.
- Monday is the last trading day of the month. The bulls want a close above the December low and above the middle of the month around 4510. It is attainable if they can get a strong rally on Monday.
- The bears want January to close near the low. However, the bears repeated attempts to create follow-through selling this week failed. If the Emini can’t go down, it will probably try the other direction.
- Al said that the current OO pattern follows an OO pattern in October. Consecutive attempts at a top in a buy climax have an increased chance of a reversal down. January is the sell signal bar for the OO. If February trades below the January low, it will trigger the OO sell signal.
- The bears want a breakout below January and a measured move based on the height of the OO which will take them to around 3600.
- However, if January closes above the middle of the bar and above December’s low, it will have a long tail below. That is a weak sell signal bar. Selling below a weak sell signal bar at the bottom of a 6-month trading range may be risky if more traders think the trading range is more important and would, therefore, BLSH (Buy Low Sell High).
- The bears will need February to close as another bear follow-through bar below January’s low to convince traders that a deeper correction is underway.
- The bulls see the current move as a long-overdue pullback. They want a reversal higher from a double bottom bull flag with October low and a retest of the trend extreme and a subsequent breakout to a new high.
- So, Monday is an important day as it would result in either January being a bearish bar or a neutral to a slightly bullish bar.
- Al has said that the bull trend on the monthly chart has been very strong. Therefore, even if there is a sharp selloff down to the October low in the 1st half of this year, it should be minor. Even if it sells off for a 10 to 20% correction, that would still only be a pullback on the monthly chart even though it could be a bear trend on the daily chart and not continue straight down into a bear trend.
- The best the bears will probably get on the monthly chart is a trading range for many months to around a 20% correction down to the gap on the monthly chart below April 2021 low and around the 4,000 Big Round Number
- We have said that this rally is overextended and there is a likely micro wedge forming which makes it less likely that it will continue up throughout 2022 without a pullback. January is the pullback.
- Therefore, the bull trend will probably transition into a trading range for at least a couple of months. The trading range may have already begun from July 2020.
- Al has said that the bull trend from the pandemic crash has been in a very tight bull channel. The first reversal down will probably be minor even if it lasts a few months.
- The gap up in April 2021 could lead to a measured move up to 5,801.5 before the bull trend finally ends.
The Weekly S&P500 Emini futures chart
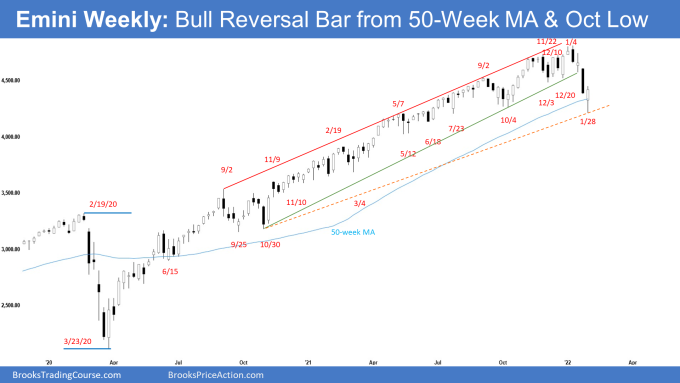
- This week’s Emini weekly candlestick was a strong bull reversal bar with a small tail above, reversing up from below October low and the 50-week MA. It closed near the high and above last week’s close.
- The bears failed to get follow-through selling following last week’s strong bear breakout.
- Since this week is a strong bull reversal bar, it is a strong buy signal bar for next week. Should the Emini trade below this week’s low, odds are there will be buyers below.
- The bears want a second leg sideways to down after any pullback (bounce) from a lower high major trend reversal. It would then be a reversal lower from head & shoulders (H&S) top where the lower high is the right shoulder.
- The bears want the pullback (bounce) to have overlapping bars with bear bars closing near the lows and weak bull bars. If they get that, the odds of a strong second leg lower increases.
- However, a H&S top often is a minor reversal pattern. The 3rd push down from the right shoulder often is the 3rd leg in what will become a wedge bull flag.
- Last week, we said that the bulls want a strong bull reversal bar even though the Emini might trade slightly lower first possibly from a double bottom bull flag with October low which is also around the 50-week moving average. They got that this week.
- The bulls see the selloff in the last 4 weeks as a bear trap and a sell vacuum test of the bottom of the 6-month trading range. Since this week closed near the high, next week may gap up at the open. Small gaps usually close early.
- The bulls want a strong follow-through bar closing near the high. If they get that, odds are the week after should trade at least slightly higher still. If the bulls get consecutive bull bars closing near their highs in the next 1 to 3 weeks, we may get another strong leg up like the one from the October 2021 low. However, keep in mind that V bottoms are rare and less likely.
- The minimum targets for the bulls are the December low or a 50% pullback of the selloff around 4510.
- The selloff in the last 4 weeks was strong enough that traders expect at least a small second leg sideways to down after a pullback (bounce). If the bulls get consecutive bull bars closing near their highs in the next 1 to 3 weeks instead, it can lead to a retest of the trend extreme.
- Al has said that the Emini has been in a strong bull trend since the pandemic crash. There have been a few times when the bears got the probability of a correction up to 50%, but never more. The probability of higher prices has been between 50 and 60% during this entire bull trend. It has never been below 50%. That continues to be true.
- The strong selloffs, like in September 2020 and again in 2021, pushed the probability for the bears up to 50%. But every prior reversal has failed, and the bears never had better than a 50% chance of a trend reversal.
- The Surprise Bear Breakout last week may have increased the odds of a correction back to 50% or just slightly more, but the bears failed to get follow-through selling below the bottom of the 6-month trading range.
- Al has said that the best the bears probably can get this year is a 20% correction down to around the 4,000 Big Round Number. This remains true.
- For now, next week should trade at least slightly higher. Whether the bulls get a strong follow-through bar next week or not will be a piece of key information.
The Daily S&P500 Emini futures chart
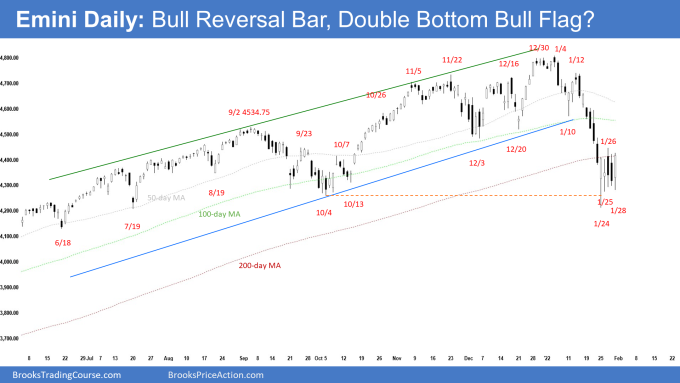
- The Emini gapped down far below the 200-day moving average on Monday and traded below October low but reversed back up to close as a strong bull reversal bar. The bulls however did not get follow-through buying on Tuesday and Wednesday. The Emini traded sideways in a tight trading range instead.
- Friday triggered the low 1 sell signal bar but reversed higher to close near the week’s high as an outside bull bar around the 200-day moving average. It is a good high 2 bull signal bar for Monday. Since Friday closed near the week’s high, next week may gap up at the open. Small gaps usually close early.
- The bulls see the recent selloff as a sell vacuum test of the trading range low which started in July 2021. As strong as the selling is, they want the selloff to simply be a bear leg in the developing 6-month trading range.
- Bulls then want a double bottom bull flag with October low and a rally to re-test the trend extreme.
- The selloff from the wedge top was stronger than all prior pullbacks since the pandemic crash. The move down from the high is in a tight bear channel which means strong selling.
- Odds favor a second leg sideways to down after any pullback (bounce), probably from a lower high around the December low and the 100-day moving average which also happens to be a 50% pullback of the selloff just above 4500.
- The bears then want a reversal from a lower high which will be the right shoulder of a H&S (head & shoulders) top. They then want a strong break below the 6-month trading range and a measured move down to around 3600 based on the height of the 6-month trading range.
- However, a H&S top is often a minor reversal pattern. The 3rd leg down from the right shoulder often is the 3rd push down in what will become a wedge bull flag.
- Less likely, the pullback (bounce) will turn into a small pullback bull trend testing the trend extreme like the one in October. However, if the bulls get a series of consecutive bull bars closing near their highs in a tight bull channel, it can change the odds in the bull’s favor.
- Al said that the entire rally from July looks like a bull leg in what will become a trading range. By trading below October low, traders concluded that the bull trend has evolved into a trading range.
- A trading range in a strong bull trend eventually turns into a bull flag instead of leading into a bear trend. The odds favor a continuation of the trend making a new high probably in the second half of the year.
- For now, there may be a bounce following recent oversold conditions. Odds favor a second leg sideways to down after the bounce is over.
EURUSD Forex market
The EURUSD weekly chart
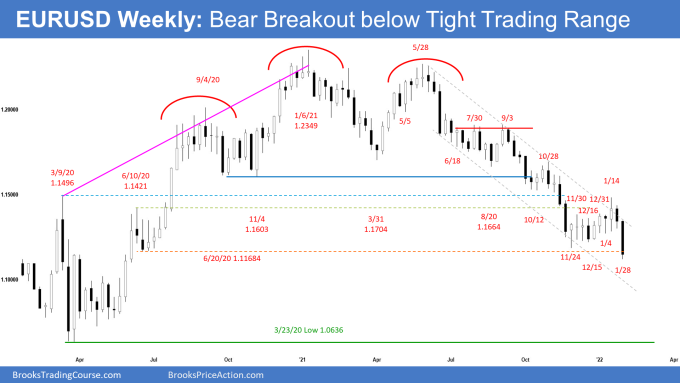
- This week’s candlestick on the weekly EURUSD Forex chart was a Big Bear Surprise breakout bar closing near its low. It closed below the lows and closes of the prior 9 candlesticks and below the June 2020 low.
- Since this week is a big bear bar closing near the low, it is a good sell signal bar for next week.
- The bears want a 200-pip measured move down based on the height of the 7-week tight trading range. They then want a continuation of the 700-pip measured move lower which started in October.
- They hope the yearlong bear trend will continue down to the 2020 low and then below the bottom of the 7-year trading range.
- If the bears get strong follow-through bear bars closing near their lows in the next 1 to 2 weeks, odds will favor a test of the 2020 low.
- We have said that a tight trading range late in a trend often is the final flag of the move. Even if there is a break below the 7-week trading range, odds are it might be the final flag of the bear leg. The EURUSD may then test below June 2020 low before there is a stronger reversal higher from a lower low major trend reversal. This remains true.
- However, the bulls will need to create bull bars closing near their highs in the next few weeks to increase the odds of a failed breakout below the tight trading range.
- The recent 2 months sideways to up trading has relieved the prior oversold conditions and bears are more confident to sell again.
- Al said that the EURUSD has been sideways for 7 years. Since trading ranges resist breaking out, it is still more likely that this selloff will reverse up for many months before breaking below the 7-year range.
- However, the more consecutive bear bars on the chart, the higher the odds will be of a successful breakout.
- Odds favor at least slightly lower prices next week.
- Bulls will need a strong bull reversal bar or at least a micro double bottom before they would be willing to buy aggressively.
The EURUSD daily chart
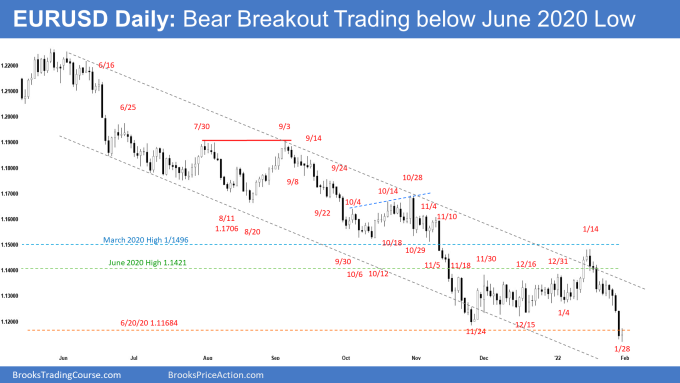
- The EURUSD traded lower from Monday to Wednesday and then had a Big Bear Surprise breakout below the 7-week tight trading range on Thursday. However, the bears did not get follow-through selling on Friday.
- The selloff from January 14 is in a tight bear channel and is strong enough for traders to expect at least a second leg sideways to down after a pullback (bounce).
- The 9-week sideways to up trading relieved some of the prior oversold condition, and bears are now more confident about selling again.
- The next target for the bears is the bottom of the yearlong bear channel, which is another 100 pips below.
- Bears then want a 200-pip measured move down based on the height of the 7-week tight trading range and then a continuation of the 700-pip measured move that started in October.
- The bulls want the 7-week tight trading range to be the final bear flag of the bear leg.
- They will need to create consecutive bull bars closing near their highs to convince traders that the recent breakout below the tight trading range will fail.
- The bears have about a 40% chance for the EURUSD to continue straight down after the recent 9-week sideways to up trading. However, if the bears continue to get consecutive bear bars closing near their lows, the odds of a test of the 2020 low will increase.
- It is still more likely that a break below the 7-week tight trading range will reverse up within a few weeks from a final bear flag. However, the bulls will need to do more by creating strong bull bars to convince traders this is the case.
- Following the Big Surprise Bear breakout, bulls will need at least a strong bull reversal bar or a micro double bottom before they will be willing to buy aggressively.
- For now, odds slightly favor sideways to down.
Trading Room
Traders can see the end of the day bar-by-bar price action report by signing up for free at BrooksPriceAction.com. I talk about the detailed Emini price action real-time throughout the day in the BrooksPriceAction.com trading room. We offer a 2 day free trial.
Weekly Reports Archive
You can access all weekly reports on the Market Analysis page.

