Monthly S&P500 Emini futures candlestick chart:
Weak rally after buy climax
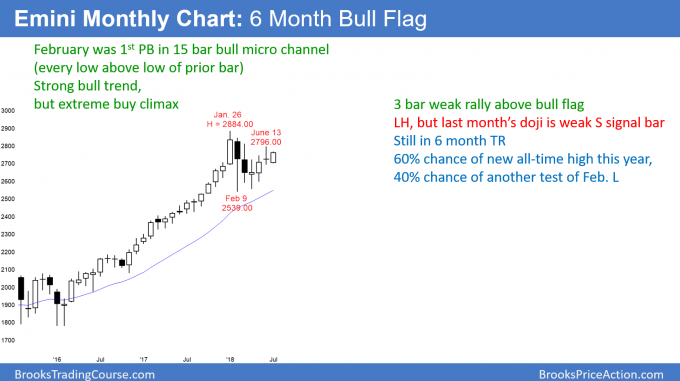
July so far on the monthly S&P500 Emini futures candlestick chart is a small bull bar. The 3 month rally has been weak and more sideways trading is likely.
The monthly S&P500 Emini futures candlestick chart has been sideways for 6 months. This follows the most extreme buy climax in the 100 year history of the stock market.
Since last month closed near its low, it is a sell signal bar for this month. However, it is a doji in a 6 month tight range. Therefore, there are probably more buyers than sellers below last month’s low. Furthermore, the 4 month rally has been weak. Consequently, the monthly chart is likely to go sideways for at least another month.
Because last year’s bull trend was so strong, the odds favor a test of last year’s high. But, buy climaxes usually have at least 2 legs sideways to down. Therefore, June might be a pullback (bounce) from the 1st leg down. There is currently a 40% chance of a 2nd leg down that falls below the 20 month EMA before there is a new high.
Weekly S&P500 Emini futures candlestick chart:
Bull channel in 6 month trading range
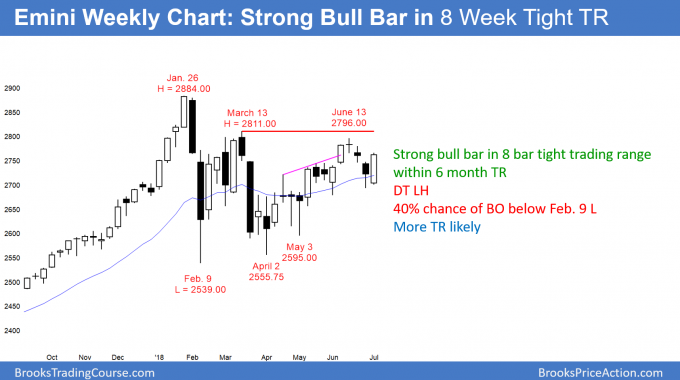
The weekly S&P500 Emini futures candlestick chart had a bull trend bar this week in a 14 week tight bull channel. It is therefore a buy signal bar for next week. However, as long as this rally stays below the March high, it is only a bull leg in a 6 month trading range.
The weekly S&P500 Emini futures candlestick chart turned down a month ago from a double top lower high with the March high. The 3 month rally was also a wedge. However, this week rallied after a 3 week selloff. In addition, it was a bull trend bar and therefore a buy signal bar for next week.
But, the 3 week selloff followed a 3 month rally that had 3 legs up. That rally is therefore a wedge top. A reversal down from a wedge usually has at least 2 legs. So, even if next week goes above this week’s high, the rally might only last a week or two. The bears will try for a 2nd leg sideways to down.
There is currently a 40% chance of a test of the February low before a break above the March high. In addition, there is a 30% chance of a strong break below the February low. That would be a 2nd leg down after the strong 1st leg down in February.
Trading ranges always look like they are about to break out
The past 8 weeks have been in a tight range, and trading ranges resist breaking out. Furthermore, this tight range is in the middle of the 6 month trading range. Therefore, the odds are that the Emini will continue mostly sideways for at least another week or two, even if next week continues this week’s rally.
When a market is in a trading range, each leg up and down always looks like the start of a trend. However, 80% of them fail and lead to opposite legs. Until there is a breakout, there is no breakout. The odds continue to favor reversals every few weeks.
Daily S&P500 Emini futures candlestick chart:
Turning up from higher low
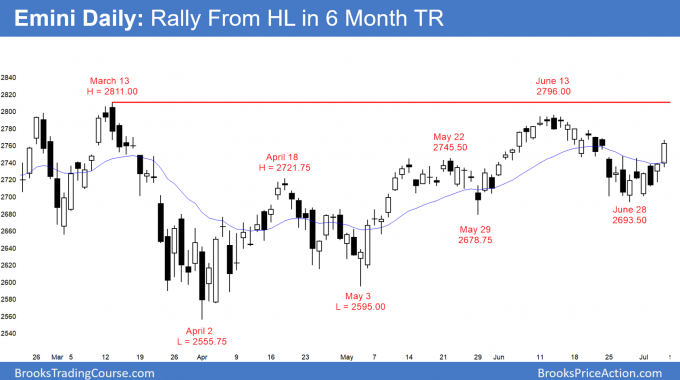
The daily S&P500 Emini futures candlestick chart sold off for the past month after a wedge rally. The odds favor higher prices next week. But, a wedge top usually has a 2nd leg down.
The daily S&P500 Emini futures candlestick chart reversed up this week. Since it formed a higher low compared to the May 29 low, it is still in the bull trend that began with May 3 low.
However, the month-long bear channel was tight. In addition, a wedge top usually has a 2nd leg down. Therefore, the odds are that any rally will stall within a couple of weeks.
The bears want a lower high major trend reversal after the 3 month bull trend. That lower high would be after a wedge top. Hence, it would also form a right shoulder of a head and shoulders top.
Most tops lead to trading ranges and not opposite trends. So, a selloff from a lower high would probably be just a 2nd leg down from the May high. The 6 month trading range would then likely continue. Until there is a strong breakout up or down, traders will continue to take profits after a few days and up to a few weeks.
Traders can see the end of the day bar-by-bar price action report by signing up for free at BrooksPriceAction.com. I talk about the detailed Emini price action real-time throughout the day in the BrooksPriceAction.com trading room. We offer a 2 day free trial.
When I mention time, it is USA Pacific Standard Time (the Emini day session opens at 6:30 am PST, and closes at 1:15 pm PST). You can read background information on the intraday market reports on the Intraday Market Update page.


