Market Overview: Weekend Market Analysis
SP500 Emini reversal up from below the 100-day moving average on the daily chart. The Emini might have to go sideways for a couple of weeks as traders decide if the 100-day moving average support is more important than the 50-day moving average resistance. If the bulls can get consecutive big bull bars closing on their highs next week, the rally will probably continue up to a new high from a double bottom bull flag. The bears want at least a small 2nd leg sideways to down within a week or so.
The EURUSD Forex consolidated in a trading range over the last 5 trading days and is in breakout mode. The bears are looking for a resumption of the bear trend to below the November 2020’s low, followed by a 700-pip measured move down based on the height of the yearlong trading range. However, the current sell-off is more likely a bear leg in the 4-month trading range, and there should be buyers below August or November’s low.
EURUSD Forex market
The EURUSD weekly chart
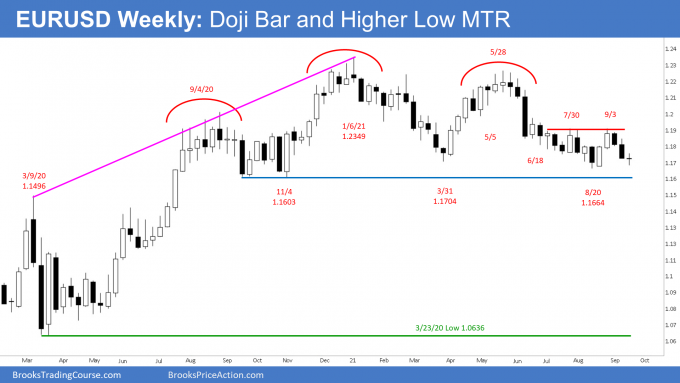
- This week’s candlestick on the weekly EURUSD Forex chart was a doji bar.
- It is a 1-bar (1 week) trading range which is an area of balance between the bulls and bears.
- This week’s candlestick is a higher low major trend reversal but a doji bar following 2 big bear bars is a weak setup for a strong bounce to test September’s high.
- If the EURUSD trades higher, it should only be a minor pullback and last a few days. The bears will sell a 1- to 3-day pullback, hoping for a micro double top with September 22 high or from September 17 double top bear flag.
- The bears are hoping for a resumption of the May to August bear trend to below the November 2020 low, followed by a 700-pip measured move down, based on the height of the yearlong trading range.
- The bulls are hoping for a double bottom major trend reversal, even if the low is slightly below August or November’s low.
- A reversal up from below the March low would also be a wedge bull flag with the March and August lows.
- If the EURUSD re-test the August or November’s low, odds are there will be buyers around the lows of the yearlong trading range.
- Most breakouts from trading ranges fail. Markets have inertia and tend to continue what they have been doing.
- Therefore, the yearlong trading range is likely to continue, even if there is 1st a dip below the bottom.
- The monthly candlestick will close at the end of next Thursday. The bears want the monthly candlestick to close near the low which will increase the odds of at least slightly lower prices in October. The bulls want the monthly candlestick to close around the middle of the bar which is around the open of the bar at 1.1807 to reduce the recent bearishness. If the bulls get that, September would be a doji bar and would likely lead to an extension of the trading range.
The EURUSD daily chart
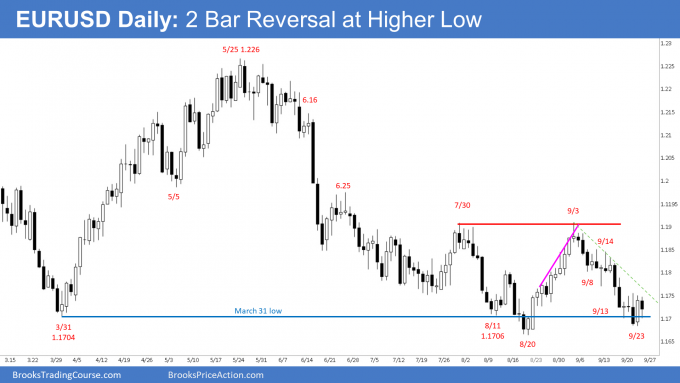
- The EURUSD Forex daily candlestick chart formed a small trading range in the last 5 days.
- There is a 2-bar reversal on September 22 and 23 but the bull signal did not trigger on Friday and closed as an inside bar instead.
- Since Friday’s candlestick is an inside bar, the EURUSD is in breakout mode for either direction.
- A reversal up from here would be a higher low major trend reversal. A major reversal setup with a good signal bar has a 40% chance of leading to a trend reversal. In 60% of instances, it leads to a continuation of the trading range or a resumption of the selloff.
- Since the bear channel over the past 3 weeks is tight, the first reversal up would probably be minor and last only a few days.
- The bears will sell a 1- to 3-day pullback, hoping for a micro double top with September 22 high or from September 17 double top bear flag around the bear trend line drawn across September 3 to September 14 highs.
- Even though the move down is in a tight bear channel, it is more likely just a bear leg in a trading range and a test of the trading range lows.
- The bears want a test of the November 2020 low (not shown), followed by a 700-pip measured move down based on the height of the yearlong trading range.
- The bulls want a double bottom major trend reversal, even if EURUSD trades slightly below August or November’s low.
- Most breakouts from trading ranges fail. Markets have inertia and tend to continue what they have been doing.
- Since trading ranges resist successful breakouts, there should be buyers around August or November’s low and just below last year’s low, which is the bottom of the yearlong range.
- If the bears get consecutive big bear bars closing on their lows and below that November low (not shown), traders will conclude that the trading range has ended on the weekly chart and that the EURUSD has evolved into a bear trend. It has been in a bear trend on the daily chart since May.
- The bulls need at least a couple of big bull bars closing on their highs before traders will conclude that a swing up to the September high is underway.
S&P500 Emini futures
The Monthly Emini chart
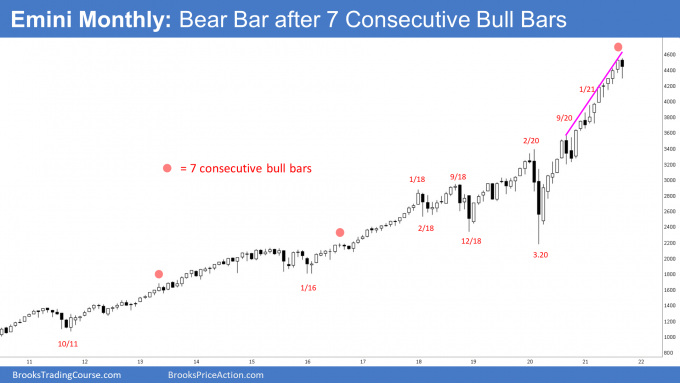
- The candlestick on the monthly Emini chart so far is a bear bar with a long tail below. It is the first bear bar after a streak of 7 consecutive bull bars and the possible start of a 2- to 3-month correction.
- August was the 3rd time in the 25-year history of the Emini when there was a streak of 7 consecutive bull bars. On the monthly chart of the S&P500 cash index, there have only been 6 times in over 60 years when there was a streak of 8 bull bars. There has not been a streak of 9 bars in that time. September or October should be a bear bar on both monthly charts.
- If September or October is a bear bar, it should lead to a 2- to 3-month correction of 15 to 20%. Look at the chart. You can see that this is what typically happens after a bear bar in a buy climax.
- The odds of a correction increase if the bear bar has a big bear body and closes near the low.
- There are another 4 trading days before the monthly bar closes.
- The bears want September to close at least below the middle of the bar around 4420 or lower and be the start of the 15 to 20% correction.
- The bulls want the Emini to close above the middle of the bar with a long tail below. They prefer a close above the open of the month, but that is about 83 points away and probably too far above for the Emini to get there next week, the final week of September.
- September should have a bear body. However, the bulls will try to have it close above the midpoint of the month. If so, it would increase the chance of October being sideways instead of down.
The Weekly S&P500 Emini futures chart
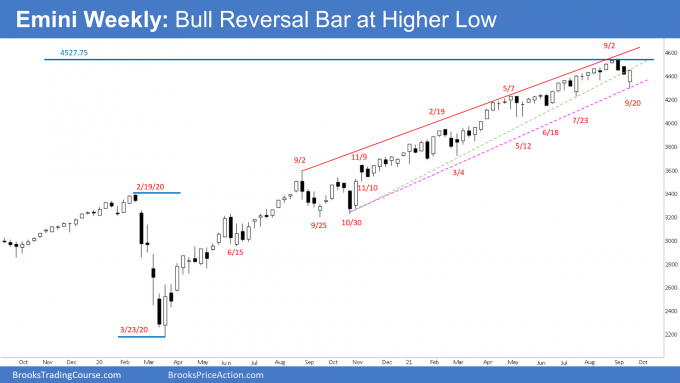
- The weekly Emini candlestick closed near the high as a bull reversal bar with a long tail below.
- The bulls want the breakout below the trend line to fail. The bulls know that in a strong trend, most reversal attempts fail and are hoping that it will be the same again this time.
- The bulls need another follow-through bar next week that closes near the high to convince traders that the reversal attempt over the last 3 weeks was simply a pullback and the trend will resume once again. If they get that, the rally will probably continue up to a new high from a double bottom bull flag with July 23 low.
- Since this week is a bull bar that closed near the high, it is a good buy signal bar and odds favor at least slightly higher prices next week.
- The bears want at least a small 2nd leg sideways to down after a brief pullback and for the Emini to close below 4420 which is the middle of the monthly candlestick by next Thursday.
- There is a 50% chance that September 2 will remain the high for the rest of 2021. Since there is a 50% chance that the September 2 high will be the high of the year, there is a 50% chance that a 15% correction is underway.
- A 50% chance of September 2 being the high of the year means a 50% chance there will be a new high.
- The Emini has been in a Small Pullback Bull Trend for more than 60 bars, which is unusual, and therefore unsustainable and climactic.
- Traders will conclude that the Small Pullback Bull Trend has ended once there is a big pullback. The biggest pullback so far was the 10% selloff in September 2020. A bigger pullback typically means 15 to 20%, and that is why the correction should be at least 15%.
The Daily S&P500 Emini futures chart
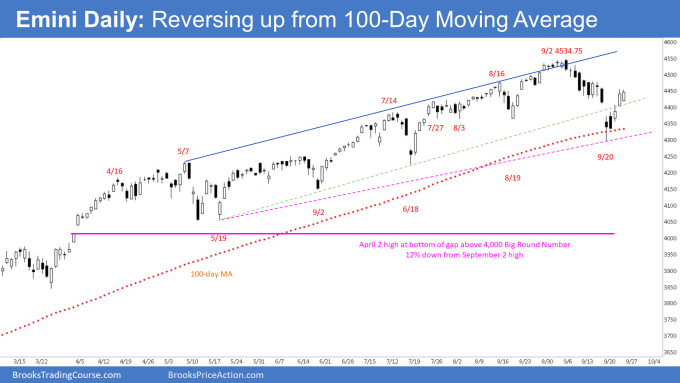
- Monday gapped down on the daily and weekly charts and sold off strongly to far below the weekly bull channel (not shown) and the 50-day MA (not shown). It reversed up from below the 100-day MA, the 4300 Big Round Number, and below the August 19 and the August 3 lows, which means the August low.
- Traders are deciding if a 15% correction to below 4,000 has begun or if the selloff is just another one of many sharp selloffs since the pandemic crash. Traders bought every one, and they soon had a new high.
- The 50-day MA (not shown) has been support since last year’s reversal up. Monday’s selloff fell far enough below so that it might now be resistance.
- Since the 100-day MA was support on Monday, the Emini might have to go sideways for a couple of weeks as traders decide if the 100-day MA support is more important than the 50-day MA resistance.
- It is common for a market to enter a trading range once it has a big reversal down from a buy climax. Big reversal up after big reversal down creates big confusion. That typically results in a trading range. Traders will then decide if the bull trend will resume or reverse.
- Monday might be a V-bottom and the end of the selloff if the bulls can get consecutive big bull bars closing on their highs next week.
- If there is a new high within the next few weeks, it will probably fail above 4600. September would then be a Final Bull Flag.
- The bears want at least a small 2nd leg sideways to down within a week or so.
- There is a 50% chance that September 2 will remain the high for the rest of 2021.
- Since there is a 50% chance that the September 2 high will be the high of the year, there is a 50% chance that a 15% correction is underway. A 50% chance of September 2 being the high of the year means a 50% chance there will be a new high.
Trading Room
Traders can see the end of the day bar-by-bar price action report by signing up for free at BrooksPriceAction.com. I talk about the detailed Emini price action real-time throughout the day in the BrooksPriceAction.com trading room. We offer a 2 day free trial.

