Market Overview: Weekend Market Analysis
The SP500 Emini futures reversed up strongly this week. It is breaking above a 3-month trading range and a measured move target. Emini rally accelerating into the 4th of July possible.
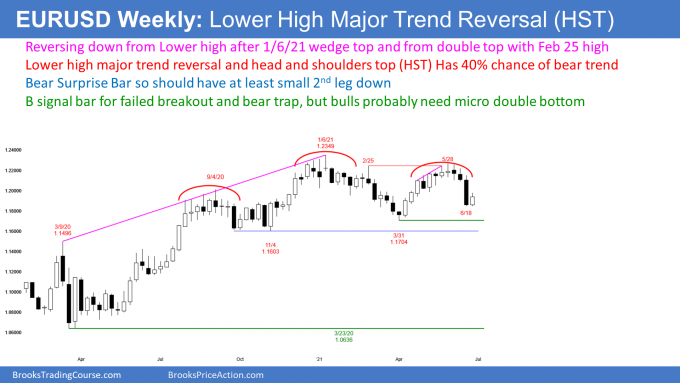
The EURUSD Forex market formed a bull inside bar after a big bear breakout last week. This creates confusion and it reduces the chance of a big move up or down next week.
EURUSD Forex market
The EURUSD weekly chart

- This week’s low was above last week’s low and its high is below last week’s high. This week is therefore an inside bar.
- An inside bar is a Breakout Mode pattern.
- It is a Low 1 sell signal bar, but because it had a big bull body, it is a weak sell setup. There are probably buyers not far below its low.
- It is a buy signal bar for a reversal up from last week’s sell climax. But last week was surprisingly big, and traders expect at least a small 2nd leg sideways to down. Therefore, there are probably sellers not far above.
- With buyers below and sellers above, traders expect sideways trading for at least another week.
Final week of the month
- Next week is the final week of June. Bars tend to change their appearance just before the close.
- The bulls want June to close above the May low on the monthly chart (not shown). That would increase the chance of sideways to up trading in July.
- The bears want June to close below the May low and at the low of the month. That would increase the chance of lower prices in July.
S&P500 Emini futures
The Weekly S&P500 Emini futures chart

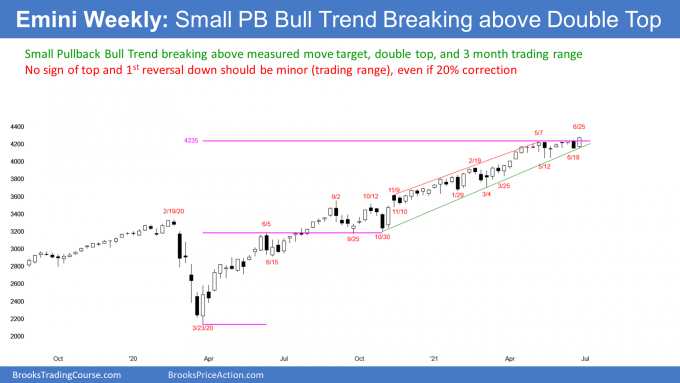
- Every week I write the same thing. While the bull trend has been extreme and it will end at some point, most reversal attempts will fail. Traders should continue to expect higher prices. This week’s rally was yet another example.
- Last week was a big bear bar, and it turned down from a double top with the May 7 high. The high was also just above a measured move up from last year’s March 23 low and June 25 high. The bears were hoping that this would end the Small Pullback Bull Trend.
- However, this week was a big bull bar and it closed near the high of the week. Additionally, it closed at a new all-time high. It totally erased last week’s attempt at a top. The Emini might gap up next week on the weekly chart.
- When the odds favor a top, yet the rally continues up, sometimes the bears completely give up. This can result in an acceleration up and a very strong rally. Early April was an example.
- A strong rally late in a bull trend often attracts profit takers. If there is strong acceleration up over the next couple weeks, there would be a risk that the Emini might then abruptly reverse down. That would be a blow-off top and an exhaustive buy climax.
- This might happen over the next few weeks for several reasons: it was reasonable to expect profit taking at the measured move target, yet the Emini is breaking above that resistance; the Emini stalled around 4,200 for a couple months and is now breaking above it; June 26 to July 5 is a seasonally bullish window; last week’s reversal up was very strong; and, the Fed will probably be quiet for at least a couple weeks after it changed its statement this month, which reduces the chance of a bearish surprise.
The Daily S&P500 Emini futures chart

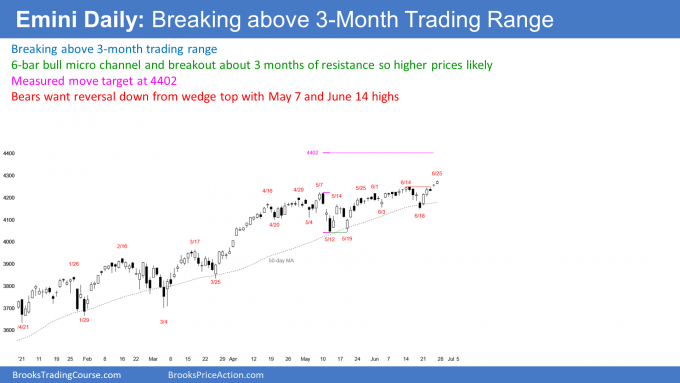
- Strong rally on Monday and Tuesday with follow-through buying for the rest of the week.
- Breakout to a new high.
- 6-bar bull micro channel and four of the past 5 days had bull bodies.
- Bulls want a measured move up based on the height of the 3-month trading range.
- There are many choices for the bottom and top of the range. However, the range is about 200 points tall, and the top was around 4,200. Therefore, a reasonable target is 4,400.
- There is a 40% chance that this rally will reach that target this summer, and it could get there next week. However, the rally might top out somewhere below.
- There is currently only a 30% chance of a correction starting in the next few weeks.
- Traders will continue to buy 1- to 3-day selloffs, even when they are strong, like last week’s.
- Long ago, the 4th of July week used to have light volume and lots of tight trading ranges. With most of the volume now traded by computers, this is less of an issue.
What about the bears?
- The bears will probably need at least a micro double top before they get even a minor reversal down. Therefore, the bulls will buy the 1st 1- to 3-day pullback.
- If the bears get a reversal down next week, it would be from the 3rd leg up in a wedge top. May 7 and June 14 were the 1st two tops.
- If the reversal down was strong, traders would expect a 2nd leg down. They would then wonder if the yearlong rally was finally ending and converting into a trading range.
- Even though there should be a 15 – 20% correction this year after such a climactic rally, the bulls will buy it. The bull trend has been so strong that traders will expect a test back up to the prior high.
- Therefore, the downside risk over the next few months is probably 20%. Any selloff should convert the bull trend into a trading range and not a bear trend.
- After several months in a trading range, there would be a 40% chance of a trend reversal (into a bear trend) on the daily chart.
Trading Room
Traders can see the end of the day bar-by-bar price action report by signing up for free at BrooksPriceAction.com. I talk about the detailed Emini price action real-time throughout the day in the BrooksPriceAction.com trading room. We offer a 2 day free trial.
Charts use Pacific Time
When I mention time, it is USA Pacific Time (the Emini day session opens at 6:30 am PT, and closes at 1:15 pm PT). You can access all weekly reports on the Market Analysis page.

