Market Overview: Weekend Market Update
The Emini is turning down from a nested wedge rally on the daily chart. This week is a good candidate for the start of a 2 – 3 week pullback.
The bond futures market has been sideways for 8 weeks after an extreme buy climax. It will probably be in a trading range for the remainder of the year.
The EURUSD Forex market has also been sideways for 8 weeks. It is in Breakout Mode. This past week’s bull bar slightly increases the chance of higher prices next week.
30 year Treasury bond Futures market:
Consecutive small inside bars after extreme buy climax
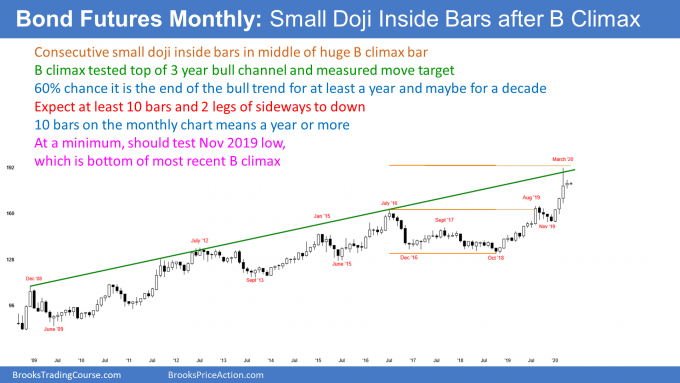
The 30 year Treasury bond futures market formed a small bull doji bar in April on the monthly chart. Its high was far below the March high and its low was far above the March low. April was therefore a small inside bar.
With only 1 day so far in May, the May candlestick is within April’s range. At the moment, there are now consecutive inside bars. This is an ii (inside-inside) pattern. This tight range is a reflection of the bond futures being in an 8 week tight trading range on the weekly chart and a triangle on the daily chart (not shown).
Also, March was a huge bar but it closed almost exactly in its middle. The big tail on its top means that traders sold strongly into the end of the month. That close in the middle is a sign that the strong bull trend is now of neutral, at least for the moment.
Traders know that the 3 month rally was the most extreme in the history of the bond market. Many bulls used the big March rally to take surprisingly be profits.
Does the buy climax mean that the bull trend has ended?
The selloff from the March high was big enough to make traders wonder if the bull trend has finally ended. They need more information.
But with exhausted bulls and scared bears, the bond market will probably have to go sideways for many bars before it begins to trend again. Traders believe that the past 2 months are the start of a trading range that will last all year.
Buy signal bar, but a buy climax is weak context
April was a bull inside bar in a bull trend. It is therefore a High 1 bull flag buy signal bar.
But there was extreme profit-taking in the end of March. Traders know that the bulls are exhausted. They will not want to buy aggressively again until after they see how strong the bears can be.
The bulls typically want to see at least a couple legs down. If the legs down are strong, the bulls will wait for the market to go sideways for several bars before buying again.
However, if the 2 legs are more sideways than down, the bulls will doubt the resolve of the bears. That will make the bulls more willing to buy again.
How long before traders decide on direction?
This process of deciding how strong the bears are typically takes about 10 bars to complete. Since this is a monthly chart, the bond futures will probably be sideways for the rest of the year.
Now what about the April buy signal bar? Since it is coming immediately after strong profit-taking, there will not be sustained buying above its highs. Traders expect a 2nd leg down. Consequently, the bulls will take quick profits and the bears will sell above the April buy signal bar’s high.
As an inside bar after a buy climax, April is also a sell signal bar. But it has a bull body and a small range. It is also the 4th consecutive bull bar on the monthly chart. Traders see that as a weak sell signal. Therefore they expect buyers not too far below.
With buyers below and sellers above, the odds favor more sideways trading. As I said, the bond futures will probably be sideways for the remainder of the year.
EURUSD weekly Forex chart:
Weak High 2 bull flag in 8 month trading range
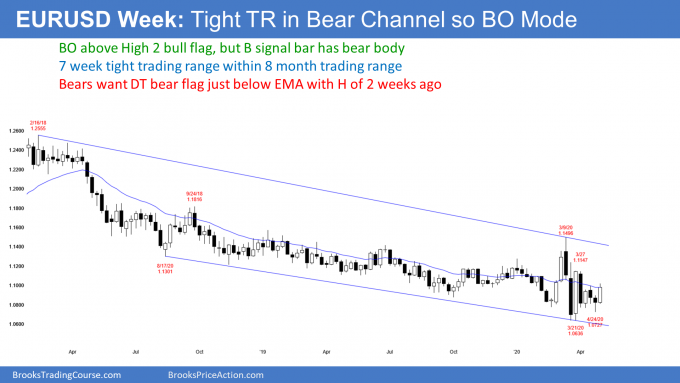
The EURUSD weekly Forex chart has had many dramatic reversal since February. It has been in a bear channel for 2 years and in a trading range for 8 months.
A trading range is a Breakout Mode pattern. The is a 50% chance of a bull breakout and a 50% chance of a bear breakout. Additionally, there is a 50% chance that any breakout will fail.
The EURUSD is in the lower half of both the bear channel and the trading range on the weekly chart. Also, the most recent strong move was the rally from the March 23 low. These factors slightly increase the probability that the next move will be up. However, until there is a breakout, there is no breakout. Traders see the weekly chart as neutral.
By going above last week’s high, the EURUSD triggered a High 2 buy signal. But the buy signal bar last week was a bear bar. Also, there were 2 consecutive bear bars. That is a weak buy setup. However, this week closed near its high. That slightly increases the chance of higher prices next week.
ioi Breakout Mode pattern on the monthly chart
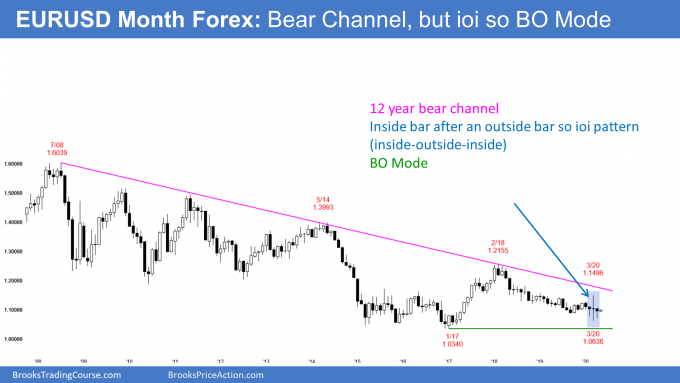
On the monthly chart, the April low’s was above the March low. Also, the April high was below the March high. April was therefore an inside bar. That is a one bar Breakout Mode pattern. In addition, March was huge and it was an outside bar. There is now an ioi (inside-outside-inside) Breakout Mode pattern on the monthly chart.
After one day, May is currently inside of April. That means consecutive inside bars (ii), which is another Breakout Mode pattern.
Since the past 3 months were all dojis, the pattern is more neutral. That reduces the chance of a strong breakout into a trend.
Furthermore, the monthly chart has been sideways for 8 months. Markets have inertia. They tend to continue to do what they have been doing. Therefore, traders expect more sideways trading.
So what happens if May breaks above or below April’s range? Most likely, not much. Trading ranges resist breaking out. Consequently, a move out of April’s range will have a hard time lasting more than a month or so. The EURUSD will probably continue sideways indefinitely.
Everyone knows that there will eventually be a breakout into a trend. But until there are consecutive big trend bars, traders will continue to look for reversals.
The coronavirus pandemic
Thirty million Americans have lost their jobs. The majority of the country has significantly curtailed its spending. Consequently, what happens with the pandemic is hugely important to the economy.
The euphoria over the past month is ending. In part, it was due to traders concluding that this is not going to be like the plague. But they will soon conclude that it also will not be as simple as the flu. The result is the the market has to remain repriced.
What happens with the pandemic and our response will determine what the new price is. Traders believe it is somewhere below the February high and above the March low.
Aggressive pursuit of a vaccine
Europe and Asia are paying the WHO to develop a couple dozen vaccines. They expect that at least one will prove to be safe and effective once the studies are complete. They might start to mass produce many of the vaccines before the studies are done so that if one is found to be safe and effective, they will have millions of doses ready immediately.
This is a smart approach, but they must make sure that whichever they choose as the best option is safe. You cannot vaccinate millions of people and then discover that 10% die 2 months later.
The United States has decided to not participate with the WHO. Instead, we are doing the same thing ourselves, but with far few vaccines. This is risky because if none of ours works, we will have lost many months and countless lives as we then try to catch up with the WHO, Europe, and Asia.
The idea of making millions of doses of several vaccines before the studies are complete is great. Doing it on our own and not combining resources with Europe, Asia, and the WHO is a political decision. It does not make scientific sense and it is not in the best interest of the American people.
Our inability to see how important testing is
I have talked a lot about our lack of adequate testing. It does not make sense that we have not been far more aggressive in manufacturing test kits and in conducting widespread tests. This is the reason why we had to shut down the economy and the reason why we have had to shut down for so long.
I don’t understand it. We’ve had months to fix this. Why aren’t Fauci and Birx screaming about this? In WWII, we quickly made all that we needed. Why are we choosing not to make 10 times or 100 times more test kits? We don’t even have enough tests for the 100 senators returning to Washington next week. Incredible.
Adequate testing will open up the economy sooner. That will save hundreds of billions of dollars and tens of thousands of lives. How much would it cost to make a few billion test kits? Nothing compared to what we are losing.
The importance of exponential growth
I talked about exponential growth in February. There are basically 3 ways for an infected person to infect someone else.
You obviously want to avoid someone who is coughing and looking very sick. If they are sick with Covid-19, they can easily spread the disease.
But there are 2 additional problems with Covid-19 that increase its spread. First, most infected people are not very sick. Many do not realize they are sick at all. Yet, they can be contagious. Next, many who end up becoming clearly sick can begin infecting others 3 days before developing symptoms.
The average infected person, whether or not he gets diagnosed or ever discovers that he was infected, infects 3 other people. Let’s assume that a person who gets infected is contagious for 2 weeks. If you start with 1 person, in 2 weeks, he is recovered, but there are now 3 new infected, contagious people. Two weeks later, there are 9.
If you graph the number of cases over time, the line curves up and to the right. When the number of infected people accelerates like that in a parabolic curve, it is called exponential growth.
How to stop exponential growth
The obvious goal in a pandemic is to eliminate the disease entirely. For example, when Europeans brought smallpox (another virus) to the North America, as many as 90% of the indigenous population (Native Mexicans and Native Americans) died. Ninety percent. Think about that. Yet, the vaccine today is so effective that smallpox virtually no longer exists.
For Covid-19, one of the major goals of disease control is to stop the exponential growth. The 1st objective is to get down to below geometric growth. In geometric growth, one person infects one other person. In 2 weeks, the 1st person is no longer contagious, but the 2nd person is. This results in the number of contagious people staying the same.
What happens if the average infected person has only a 50% chance of infecting someone else? If there are 4 contagious people today, there will be only 2 in 2 weeks, and only 1 a couple weeks later. This is the main goal in all pandemics. Get the spread rate to less than one so that the number of cases eventually gets to zero.
How to reduce the number of cases
One of the main tools to accomplish this is widespread testing. You want to find as many contagious people as possible and then keep them away from everyone else. Taiwan, South Korea, Germany, Austria and many other countries have done a much better job than the US. Our failed approach has resulted in our problem being comparable to that in developing countries.
Why is South Korea 50 times better off than the USA?
South Korea is an interesting example because their 1st known case was on January 21. That is the same day that the US had its 1st known case. They have had about 250 deaths in a population of 50 million.
The population of the US is about 6 times greater. Yet, the US has had 60,000 deaths. Our death rate is 240 times higher!
Why? Because South Korea quickly saw how serious the disease was and instantly began aggressive testing. They listened to their medical experts and decided to rely completely on science.
On the other hand, the US ignored the medical experts and chose to prioritize politics in an election year. We spent almost 2 months allowing the coronavirus to spread exponentially until the American public demanded a better response.
I did not hear leaders from either party forcefully arguing that we were horribly mishandling this crisis. As a physician, I was telling everyone throughout February that our approach was going to lead to a disaster. I’m certain that most other doctors felt the same way. But we are not the people making the decisions.
Fortunately, many governors began to do what the federal government should have done. While that has slowed the progress of the disease, it is still spreading exponentially.
Freedom has consequences
Not many of us want to live in China because we like freedom. But a strong centralized government can be good in a pandemic. China was slow to react, but once they did, they quickly got the spread under control. South Korea effectively used a strong federal response and it also saved thousands of lives.
We are the most free people in the world. One of our freedoms is a right to ignore science and do dumb things. States are free to eliminate social distancing guidelines. There are no serious consequences for individuals who ignore the guidelines, and many are making that choice. The result is the disease will continue to spread exponentially for a long time. This will continue for many months after a vaccine, and that means late into 2021.
Coronavirus will not stay confined to those states with loose guidelines because people travel freely. This will cause tens of thousands of more deaths than what would have happened if the country maintained strict social distancing and had an aggressive national testing policy.
Therefore, even people and states who strongly want tight guidelines will have a far greater death rate than they otherwise would have had. Even if their view is held by the majority of the country, they do not have the freedom to chose a death rate comparable to that in South Korea.
Wars are not fought at the state level
Everyone agrees this is a war. With any other war, would we choose to have 50 governors (basically, lieutenants) each deciding how to fight its share of the war? Of course not. We would fight it a general in command. Would we ignore the military experts? No.
But this is a different kind of war and there are strong feelings about our culture, economy, and destiny. Many people do not want the federal government telling them what to do. Also, many believe that a 1% death rate is better than having ongoing damage to the economy and major changes to our lifestyle.
Looks like we are choosing herd immunity
Even if only 30% of the country chooses the economy over a hundreds of thousands of deaths, they will win. That is the herd immunity strategy. If 70% of the country gets infected, the average infected person will be more likely than not to not infect anyone. That will eventually lead to the pandemic ending.
Sounds like a good strategy, right? It is if you are not old, poor, or a minority. The death rate for the country will be about 1%, but it will be 5 – 10% among some groups.
Also, even if only 1% dies, if 70% get infected, that is 200 million infected people. Then 1% is about 2 million deaths.
Obviously no one wants 2 million people to die, but that is the chance that the herd immunity crowd is willing to take. And they have veto power over the rest of us. For social distancing to work, you cannot have 30 – 40% not participating. Those people get to choose herd immunity for everyone, not just themselves. Tyranny of the minority.
There will be a vaccine before 70% gets infected. But probably not before 10 – 50% of the country will get infected.
Remember, last week I said I do not see how fewer than 500,000 Americans will die. This herd immunity choice is the reason. There are enough who believe this way so that our result will remain comparable to that of developing nations. In fact, we are already shocking behind many developing countries in terms of the percentage of our population dying from Covid-19.
We can choose to be great, or not
We are free to choose to not be a great example for the rest of the world. And that is the path we have selected. This will this result in needless deaths. Furthermore, it will create far greater damage to the economy compared to what would have happened had we made decisions based on science instead of emotion and politics.
The percent of our population that will die will continue to be far greater than in South Korea, Taiwan, Singapore, and many other countries that are acting aggressively at the national level based on science. It’s our choice to give our citizens the same chance of survival as people living in El Salvador, Ghana, and Bangladesh.
Again, both political parties in Washington have failed to provide leadership in a national crisis. Fighting a war with 50 lieutenants in charge instead of a few generals is deadly. One party is stupid. The other is stupider.
Monthly S&P500 Emini futures chart:
High 1 Bull Flag buy signal, but in 2 1/2 year trading range
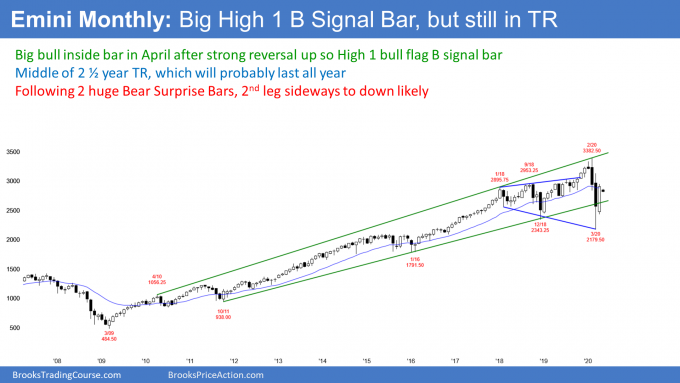
The monthly S&P500 Emini futures chart formed a big bull bar in April. Its high is below the March high and its low is above the March low. April therefore was an inside candlestick. It got back to the February close and therefore erased the March collapse. Furthermore, the 2 1/2 year trading range is within a 12 year bull trend. These factors make April a credible High 1 bull flag buy signal bar.
Traders expect May to go above the April high and trigger the monthly buy signal. But a buy signal in the middle of a trading range after a huge selloff is minor. It will probably not lead to a new all-time high
It is important to note that as strong as April was for the bulls, February and March were even stronger for the bears. Big Down, Big Up creates Big Confusion. Confusion and disappointment are hallmarks of a trading range.
The big bull bar was disappointing for the bears. If May goes above the April high, it will trigger the monthly buy signal. But because February and March were surprisingly strong, a rally from here will probably fail to get above the February high. That would disappoint the bulls. Consequently, the 2 1/2 year trading range should continue. Traders expect it to last all year.
Weekly S&P500 Emini futures chart:
Failed breakout above 20 week EMA
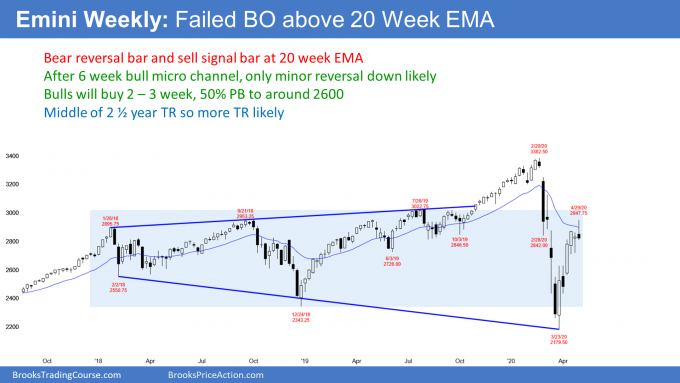
The weekly S&P500 Emini futures chart finally reached the 20 week EMA. I wrote about this last weekend. I said that the EMA was important resistance. Since the rally was strong and the Emini was near the EMA, the Emini was likely to get above the EMA this week.
However, I also wrote about last week being a doji bar in a buy climax. There are now 6 weeks where every low is above the low of the prior week. That is extreme, especially after a huge selloff. It is therefore a buy climax.
Also, last week was an inside bar in a 5 week bull micro channel. It was a buy signal bar in a strong bull trend. Traders expected this week to go above last week’s high and trigger the buy signal.
And it did. But when there is a doji buy signal late in a buy climax, the breakout typically fails within a week or two. I said that a doji buy signal bar with a big tail below often leads to a doji entry bar with a big tail above. While this past week was not big, there was a prominent tail on top. This is consistent with what I said.
Additionally, I said that the doji buy signal bar in a buy climax is often a 1 bar Final Bull Flag. That means there is an increased chance that the breakout above will fail.
Failed breakout above High 1 buy signal bar
Is this week a failed breakout above a buy signal bar? It might be, but while it has a bear body, it is not a big bear bar closing on its low. This week is therefore not a strong sell signal bar. It is at the resistance of the 20 week EMA, which is good for the bears.
However, a reversal down from a 6 week bull micro channel is typically minor. It might last a few weeks, but the bulls will expect a higher low. They will look to buy at around a 50% retracement of the 6 week rally. If this is the start of a swing down, traders should look for a higher low to form at around 2600 within a few weeks.
Remember, the Emini is in a 2 1/2 year trading range. Traders therefore expect reversals, even when legs up or down are strong.
Daily S&P500 Emini futures chart:
Nested wedge top in strong bull trend
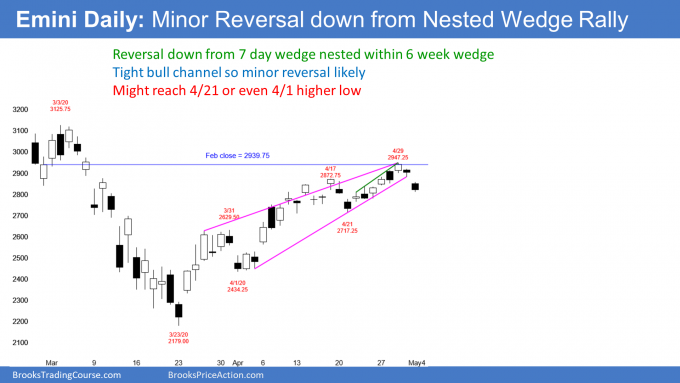
The daily S&P500 Emini futures chart has rallied strongly for 6 weeks. There are now 3 clear legs up. That is a wedge rally and that typically attracts profit takers.
Also, if you look closely at the 3rd leg up, it subdivided into 3 legs. On the 60 minute chart, you can see that these legs formed a wedge bull channel.
There is therefore a 60 minute wedge nested within a wedge on the daily chart. Nested patterns have a higher probability of working. Consequently, this week’s reversal down is probably the start of a 2 – 3 week sideways to down correction.
The 6 week rally is in a tight bull channel. Even though the bull channel is a wedge, a tight bull channel is a strong bull trend. The 1st reversal down from a strong bull trend is usually minor. Therefore, even if there is a selloff that retraces half of the rally, the bulls will buy it. They will expect at least a 2nd leg sideways to up. The 2nd rally usually tests the top of the 1st rally.
Wedge top in strong bull trend often needs 2nd reversal down
There is one more important point about wedge tops. When there is a wedge top in a strong bull trend, in general, there is a 50% chance that there will be one more brief new high before a successful reversal down begins. Thursday’s and Friday’s selloff have reduced that to 40%.
Remember, April is a buy signal bar on the monthly chart. May still might have to go above the April high. That would result in one more new high in the wedge on the daily chart. But if there is a break above the April high, traders will watch for a 2nd sell signal. A 2nd signal has a higher probability of leading to a 2 – 3 week pullback.
Trading range for remainder of 2020
If the reversal down has begun or if it stars within a few weeks, can it continue down to below the March low? There is only a 30% chance of that. The Emini has been in a trading range for 2 1/2 years. It will probably continue in the range for the rest of the year.
When there is a reversal down in a trading range, the selloff typically falls below important support. The 2nd leg up in the wedge rally broke above the March 31 high. That was the top of the 1st leg. The April 21 higher low did not overlap that high. There is therefore a gap above the March 31 high.
Gaps are common in strong trends. Since this rally is in a trading range, the gap should close. That means that traders should expect the Emini to fall to around 2600.
Wedge reversals often fall to the start of the wedge
When there is a reversal from a wedge top, the selloff often reaches the start of the wedge bull channel. That is the bottom of the 1st pullback. Here, that is the April 1 low of 2434.25.
If the Emini gets there, it might take a couple months to reach it. Because that is very far below, the current leg down will probably not get there. There will probably be a higher low and another leg up in the 2 1/2 year trading range first. But since the chart is in a trading range, the Emini will probably get there at some point this year.
It’s a trading range, so trade it like a trading range
For the next couple months, the Emini will probably stay within the 2600 – 2900 range. That trading range is within the 2 1/2 year range from 2200 to 3400.
One of the difficulties in trading ranges is that everything is less clear. Good tops and bottoms fail and the legs up and down often go farther than what looks reasonable.
Also, the legs up look most bullish just before reversing down and the legs down look most bearish just before reversing up. It is important to avoid the temptation of buying high or selling low, hoping for a new trend.
In addition, trade the chart that is in front of you and not the one you hope it becomes. Do not be upset by the reversals. They can be good opportunities for traders, but are miserable for traders hoping for sustained trends.
The 6 week reversal up was so strong that the March low will probably remain the low for the year. But the reversal down in February was also very strong. Any rally this year should form a lower high.
Trading Room
Traders can see the end of the day bar-by-bar price action report by signing up for free at BrooksPriceAction.com. I talk about the detailed Emini price action real-time throughout the day in the BrooksPriceAction.com trading room. We offer a 2 day free trial.
Charts use Pacific Standard Time
When I mention time, it is USA Pacific Standard Time (the Emini day session opens at 6:30 am PST, and closes at 1:15 pm PST). You can read background information on the intraday market reports on the Market Update page.

