Market Overview: Weekend Market Update
The Emini is rallying in a strong buy climax and it is testing the 2019 close. There is no top yet. Traders will buy the 1st 1 – 3 day pullback.
Bond futures broke below the ii pattern on the monthly chart. Traders expect sideways to down trading for many months.
The EURUSD Forex market rallied strongly for 3 weeks. However, the daily chart has an exhaustive buy climax. Traders expect a pullback for a few days next week.
30 year Treasury Bond futures weekly chart:
Reversing down below an ii on the monthly chart after an extreme buy climax
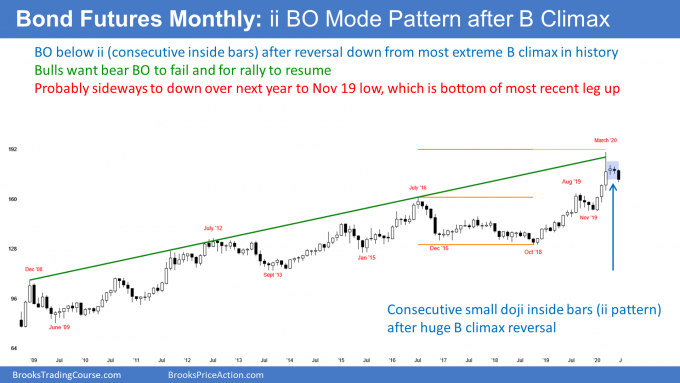
The 30 year Treasury bond futures had the most extreme buy climax in history during the 1st 3 months of this year. After a climactic reversal down in March, there were consecutive inside bars in April and May.
That is a Breakout Mode pattern. June triggered a sell signal by falling below the May low. June is currently a bear bar closing near its low. But this is only 1 week into the month. It could look very different once the month ends.
Even if the bear breakout reverses up, traders do not expect the bond futures to rally to much above the March buy climax high. In fact, most traders think that March will be the high for the next many years.
A bull trend usually transition into trading ranges before becoming a bear trend
A reversal down from a buy climax does not necessarily mean that the bull trend will become a bear trend. Even when it does, it typically has to pass through a trading range phase for at least 10 to 20 bars. Since this is a monthly chart, the trading range could last a couple years or more.
A trading range has both bear and bull legs. However, the bottom of the range might be lower than what seems reasonable. Therefore, if this week is the start of a bear leg, it could fall farther and last longer that what traders expect.
How far can a reversal down fall?
When there is a reversal down from a buy climax, the 1st target for the bears is the breakout point. That is the August 2019 high of 163 14/32.
Next, traders will look for a test of the 20 month EMA and the bottom of the most recent strong rally. That is the January low and it is more than 20 points below this week’s low.
Finally, the bond market was in a trading range from 2015 through 2018. The bottom of that range is around 125. Since traders thought that was a fair price for a long time, once the market gets there in a few years, traders expect it to go sideways there again for a couple years.
What will the price action look like?
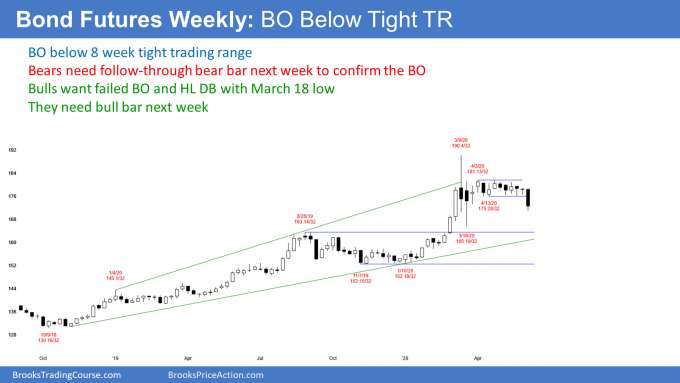
It is unlikely that this week’s reversal down on the weekly chart will be the start of a selloff that was as strong as the January to March rally. Traders do not expect the selloff to collapse in a series of big bear bars closing on their lows. More likely, there will be pullbacks along the way.
The bond market will probably be in a trading range for several years. Therefore, any trend down over the next year or two will end up as a leg in a trading range.
Legs in trading ranges typically have lots of trading range price action. There will probably not be a series of 4 or more big bear bars closing on their lows. That would be trending price action.
Furthermore, many bars will have prominent tails. That represents hesitation. Also, the market will have several places were it goes sideways for several bars.
Disappointment and confusion are hallmarks of a trading range
In a trading range, strong trend bars will typically not have good follow-through. For example, the bar after a big bear bar will probably not be another big bear bar closing near its low. Instead, a big bear bar will often lead to a bull bar. That is disappointing for the bears who want a trend.
Since the bond market will probably be in a trading range for several years, traders should expect trading range price action. Bad follow-through and bad buy and sell signal bars will disappoint traders. Repeated reversals will confuse them.
Disappointment and confusion are the hallmarks of trading ranges. If the current selloff begins to disappoint the bears within a few weeks and confuse both the bulls and bears, traders will conclude that the market is in a trading range. They will look for reversals, buy low, sell high, and take quick profits.
What to expect next week
The selloff is probably within what will be a trading range for the next few years. Consequently, traders expect disappointment. That reduces the chance of a strong follow-through bear bar next week.
Instead, traders expect anything else. For example, instead of a big bear bar closing on its low, there might be a big tail below. Or, next week could be a doji bar or even a bull bar.
If next week is a big bear bar closing on its low, there would be consecutive strong bear bars. That would increase the chance of a 3rd or 4th consecutive big bear bar.
But that is trending price action. Consequently, it is more likely that next week or the week after will disappoint the bears.
However, 2 consecutive closes below the 2 month tight trading range will increase the chance of lower prices over the next several weeks.
EURUSD Forex weekly chart:
Extreme buy climax on the daily chart should attract profit takers next week
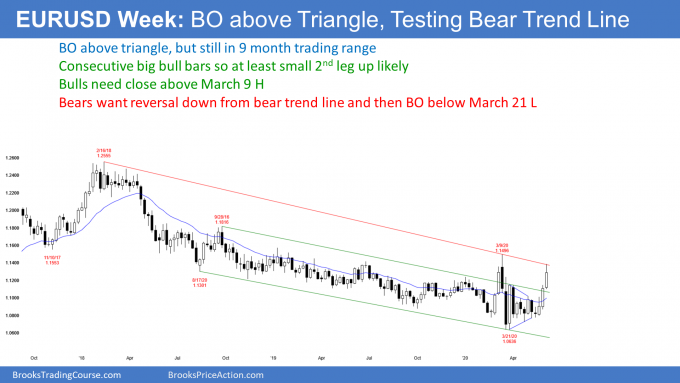
The EURUSD Forex weekly chart had a 2nd consecutive big bull trend bar this week. This is a reversal up from a higher low major trend reversal. The bars are surprisingly strong. A Bull Surprise typically has at least a small 2nd leg up. Consequently, the bulls will buy the 1st 1 to 2 week pullback.
Monthly chart triggered an ioi buy signal in May
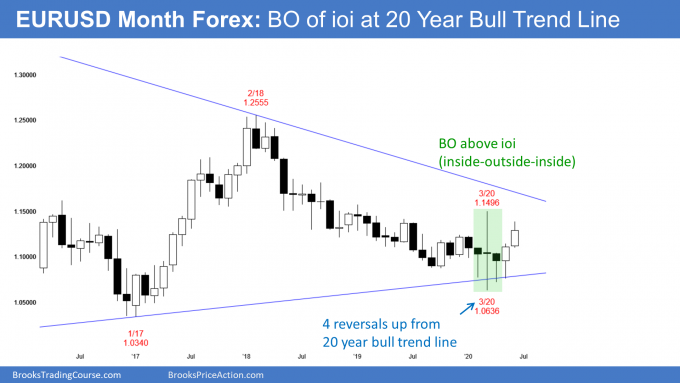
The monthly chart triggered a buy signal in May when May went above the April high. April was an inside bar after a big outside bar. An ioi (inside-outside-inside) pattern is a Breakout Mode setup. There is now a 2 month bull breakout.
The monthly chart is rallying from a higher low compared to the January 2017 low. Traders see the 2 year bear channel as a bull flag. The past 2 months are testing the bear trendline at the top of that bull flag.
If the bulls can get a monthly close above the March high, they will expect the rally to continue up to the September 2018 high. That was the start of the bear channel. That is always a target when there is a reversal up from a Spike and Channel Bear Trend. The bear spike was the April and May selloff in 2018.
Buy climax on the daily chart
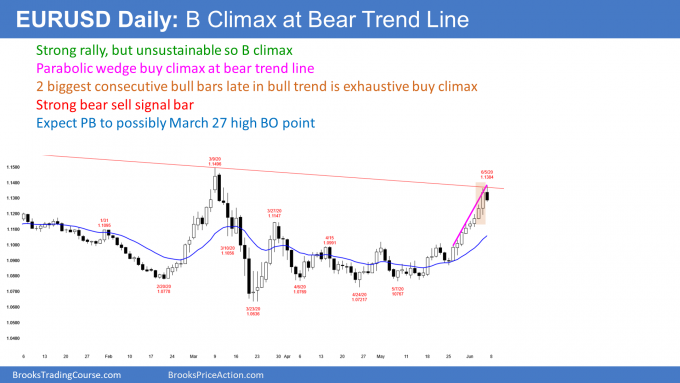
The rally on the daily chart has been exceptionally strong. After breaking above the neckline of a head and shoulders bottom, the EURUSD rallied to above the measured move target.
However, Thursday’s range was particularly big. Also, Wednesday was a fairly big bull day as well. When there is a surge like this late in a bull trend, it tends to attract profit takers. There is a 60% chance that the EURUSD will begin to pull back next week or after one more brief leg up.
Traders expect a pullback to test the breakout point
This is a strong break above this neck line of a head and shoulders bottom. Traders usually expect a pullback to the neckline of the bottom. However, that is the May 1 high and it might be too far below. The bulls might buy aggressively before a pullback reaches that breakout point.
A common target for a selloff after a buy climax is the bottom of the most recent climactic rally. That is Wednesday’s low. It is near the March 27 high, which is another breakout point. Traders should expect a pullback to begin next week.
It is important to note that the 3 week rally was exceptionally strong. When that is the case, traders expect a 2nd leg up. Therefore, traders will buy a pullback to around Wednesday’s low, the March 27 high, and the 20 day EMA. The bears will need at least a micro double top before traders can get more than a 1 week pullback.
Pandemic Update
There is not much to add to last week’s special update. However, there was a particularly interesting report in The Lancet this week. It looked at people exposed to patients with Covid-19 in several settings, including medical centers and in homes. The researchers found a dramatic benefit from using face masks, social distancing, and eye protection.
I am surprised this report is not getting more coverage. Many people around the world are not using face masks or social distancing because they suspect it is nonsense. This study shows that being careful can reduce the risk of infection by as much as 88%. I think the public needs to know this because many people would start being more careful. This would reduce the number of infections and deaths while we wait for a vaccine.
The Lancet is one of the world’s premier medical and scientific journals. It is for scientists and not the lay public. Consequently, some of the articles use so much jargon that they can be very difficult to understand.
Lancet article on the math behind face masks and social distancing
The article that caught my attention was a statistical analysis of 172 other studies. The studies were done on 6 continents and involved 25,000 patients. None of the studies was randomized. They were all observational, which makes them less reliable.
However, the analysis found several statistically significant results. The math is boring and beyond what we need. Here is my summary of the research.
If someone is exposed to a person with Covid-19, he reduces his risk of infection by 83% if he wears a face mask. His risk of getting infected if he wears a mask is 3.1% compared to 17.4% without a mask. That is an 83% reduction of risk. The risk is even less with a N95 mask. But since the infection is mostly spread through big droplets, even a disposable mask is very helpful.
What if he stays 2 meters (about 6 feet) away from the contagious person? His risk of infection only 1.5% compared to 13% for people getting within 1 meter of the patient. That is a 88% reduction in risk. If he stays 3 meters away (10 feet) instead of 2 meters, the risk is reduced by another 50%.
Finally, they looked at people who wear eye protection, like eye glasses, googles, or face shields. Their risk of infection is 6% compared to 16% for people without. That is a 62% reduction. This is less dramatic than for face masks because most infections come through your mouth and nose.
The study helps explain the rally
If you think about it, this study provides an explanation for the dramatic reversal up from the March crash. The market sold off strongly because of New York hospitals getting overwhelmed. Everyone was afraid this experience would spread across the country and be incredibly devastating to the economy.
Once people started to be careful, the curve flattened. The rate of new cases stayed below the capacity of the hospitals to handle coronavirus patients. This prevented the New York disaster from spreading across the country. The market quickly sensed this and rallied strongly since.
Obviously, it would not have rallied without the Fed. But the Fed alone could not have done it. Traders had to feel that the pandemic was going to be much less of a problem than what the 34% selloff indicated.
The study validates common sense
Back in February and March, Dr. Fauci was saying Americans should not wear face masks unless a person is infected. He said the purpose of the mask was to prevent a patient from infecting others.
When he said that, I thought this was clearly nonsense and probably politically motivated. If everyone buys masks, there would be fewer for doctors and nurses, and the news would make the White House look even more unprepared.
Common sense told us that any barrier to the virus reduces our risk. I was wearing masks and gloves and practicing social distancing from the outset. It quickly became clear to everyone that wearing masks and keeping a distance from others made sense. The result was the rate of spread decreased to the point that hospitals could handle the new cases. This study provides a mathematical reason why being careful makes sense.
Vaccine benefit might not last long
There are several types of viruses that cause the common cold. These include rhinoviruses, Respiratory Syncytial Virus (RSV), parainfluenza viruses, and coronaviruses.
A person recovers from the cold as his body builds an immune response to the virus. Once his body makes enough antibodies, the virus can no longer infect new cells and the white blood cells clean up what virus is left.
There is one problem with the immunity that people get when their cold is caused by a coronavirus. It is that the immunity typically only lasts 3 to 6 months. Sometimes, it lasts a year.
Will we need booster shots?
The duration of the immunity is a concern for scientists trying to create a vaccine to protect against Covid-19. It is also caused by a coronavirus. If the immunity lasts a year, then the vaccine companies can simply add a coronavirus vaccine to our annual flu shot. No problem.
But what happens if the immunity only lasts 3 months? That is a major problem, not only for vaccine makers but for people who recover from Covid-19. It means they can catch it again a few months later.
Scientists are confident that they will be able to create a safe and effective vaccine. They will study how long the immunity lasts. They will measure the level of antibodies of immunized patients regularly to see if the immunity goes away. Also, how long will the antibody level be high enough to prevent reinfection?
If people can get a Covid-19 infection repeatedly after 3 – 6 months, there would be a floor to the number of infected people in society. Coronavirus would not go away. It would be endemic. There would be a lot of missed work, lower annual income, reduced consumer spending, lower corporate profits, and lower stock prices.
No one wants to get a booster shot every 3 months forever. Most people would refuse. The problem could theoretically continue for years until scientists come up with a vaccine that provides longer immunity. A reasonable minimum goal is 1 year of immunity.
Can you get Covid-19 twice?
We do not know how long immunity to Covid-19 will last. This is true whether you get immunity from having the infection or from having the disease. If your protective antibodies fall below some critical level, you can get infected again.
However, your body now knows how to make these antibodies. It does not have to figure it out again. Also, if you get Covid-19 a 2nd time, you will probably still have some immunity left over from the 1st time. That should reduce the severity of the infection.
Since your body already knows what antibodies are need, you will make them sooner. That should reduce the duration of the illness.
No one wants Covid-19 one time, let alone 2 times. However, a 2nd case will probably be much less severe.
Monthly S&P500 Emini futures chart:
Strong follow-through buying in 3 month rally
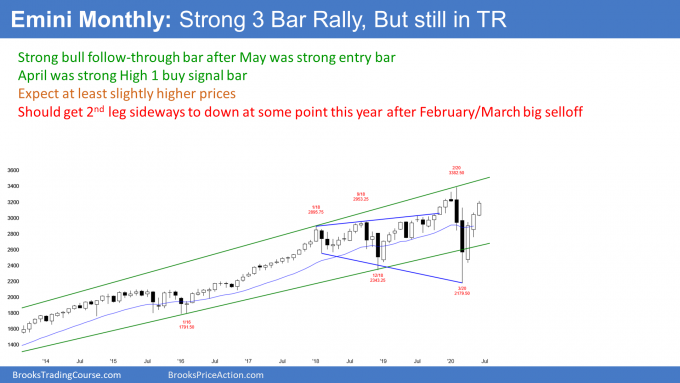
The monthly S&P500 Emini futures chart has been in a bull trend for 11 years. However, it has been in a trading range for 2 1/2 years. So far, June is a big bull trend bar. This is only the 1st week in the month. The chart could look very different one the month closes.
March broke below the bottom of the range, but reversed up. April was a strong High 1 bull flag buy signal bar. May close on its high and it therefore was a strong entry bar.
June is the follow-through bar. So far, it is also strong. Traders are wondering if the rally will continue up to a new all-time high. If June closes near its high, the probability will shift in favor of a new high within a few months.
It is still more likely that there will be a 2nd leg sideways to down after the huge Bear Surprise reversal in February and March. However, in 20% of the cases, the 2nd leg down begins after there is a new high.
With this rally as strong as it has been, there is currently a 40% chance that it will continue up to a new high before there is a pullback on the monthly chart.
Weekly S&P500 Emini futures chart:
Resumption of strong bull trend
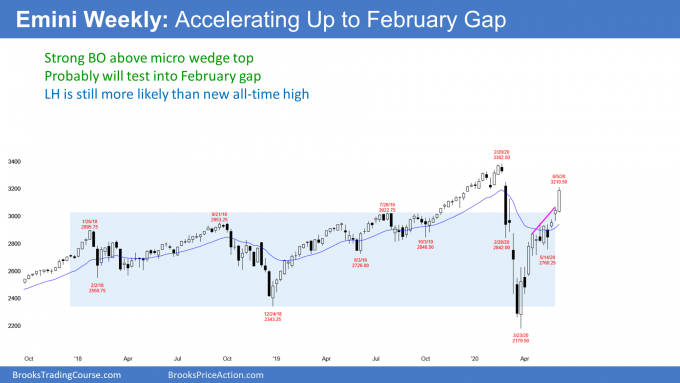
The weekly S&P500 Emini futures chart formed a big bull trend bar this week. The prior 6 weeks were not strongly bullish. They looked like they were starting to form a trading range.
This week accelerated up and resumed the V bottom bull trend reversal. This week was a Bull Surprise breakout. Traders expect at least a small 2nd leg sideways to up after the 1st pause or pullback.
Since the Emini broke strongly above the March 3 lower high, traders are looking at the next resistance above.
An obvious target is the gap above the February 24 high. That high is 3,248.75. This week’s strong rally makes it likely that the Emini will test into that gap.
Remember, the Emini rolls over into the September contract this week. That will change all of the prices.
What about a new all-time high?
Can the rally continue up to a new all-time high? Of course. Also, the closer the Emini gets to the high and the more strong bull bars it gets, the higher the probability of a new high. Currently, the bulls have a 40% chance of a new high before there is a 15% correction.
That means there is still a 60% chance of a lower high. But if next week is another big bull bar, the odds of a new high would be at least 50%.
Daily S&P500 Emini futures chart:
Parabolic wedge rally with no top yet
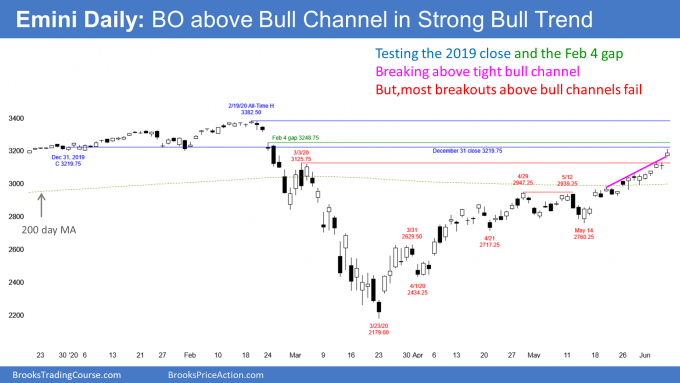
The daily S&P500 Emini futures chart has been in a parabolic wedge buy climax since it gapped up on May 19. A buy climax can go a long way before the bulls take profits. Also, once they do, the 1st leg down is usually minor.
Traders expect at least a micro double top before looking for more than a 1 – 3 day pullback. The odds favor at least slightly higher prices.
The Emini is very near the close of 2019. It will probably go above it next week. At that point, the Emini will be up on the year.
The big gap down on February 4 is just a little higher. That is a magnet as well, and therefore the Emini might test into it soon.
Most breakouts above bull channels fail. The Emini is breaking above a 3 week tight bull channel. This is happening late in a bull trend. Traders should expect at least a minor reversal down within a couple weeks.
Friday’s gap up was unusually big. That is another sign of a climax. If the Emini gaps down any day next week, there will be an island top. If there is a gap down and the bears can keep it open for a week or so, traders will begin to look for a swing down.
What is the probability of a new high?
The Emini has ignored resistance for 3 months. That is a sign of strong bulls. What we do not know is if the V bottom reversal will make a new high. Is this rally just a strong leg in the 2 1/2 year trading range?
Until this week, there was a 70% chance that the rally was going to form a lower high. But there were 5 strong days this week. Also, the Emini broke strongly above the resistance of the 200 day moving average and the March 3 lower high.
Traders now believe that the bulls have a 40% chance of a new high before there is more than a 3 day pullback. If next week continues up strongly, the probability will go up to 50 – 60%.
Once there is a reversal, how big will it be?
Since the bull trend began in March, every selloff for 3 months reversed back up within 3 days. The bulls have been very eager to buy.
At some point, they will take profits. When they do, the bears will see the profit-taking and they will sell as well. This will create a deeper and longer pullback.
Once there is a correction, one of the 1st targets is the bottom of the most recent leg up. That is the May 14 low of 2760.25. Since that is near 20% down from the high, the Emini would probably fall below that level as well. It would then be back in a bear market.
In April, the Emini broke strongly above the March 31 high of 2629.50, but never tested that breakout point. It therefore also a magnet for the bears.
Traders are deciding if the rally is a bull leg in the 2 1/2 year trading range or a resumption of the 11 year bull trend. Right now, it is still more likely a leg in the trading range. If it is, traders will expect a reversal down to retrace about half of the rally. That would be about a 15% correction down to around 2700.
However, if the rally continues up to a new high, traders will conclude that bull trend has resumed. But most trading range breakouts fail. Consequently, there will probably be sellers not too far above the February all-time high.
Trading Room
Traders can see the end of the day bar-by-bar price action report by signing up for free at BrooksPriceAction.com. I talk about the detailed Emini price action real-time throughout the day in the BrooksPriceAction.com trading room. We offer a 2 day free trial.
Charts use Pacific Standard Time
When I mention time, it is USA Pacific Standard Time (the Emini day session opens at 6:30 am PST, and closes at 1:15 pm PST). You can read background information on the intraday market reports on the Market Update page.

