End of day video review
Trading Update: Monday April 15, 2024
S&P Emini pre-open market analysis
Emini daily chart
- The Emini is getting more selling pressure below the moving average. This is a sign that the daily chart is evolving into a trading range. Because the market is likely in a trading range, the odds favor a rally lasting a few days.
- While this is good for the bears, the market has not been this far below the moving average in several months. This increases the odds of a rally over the next several days.
- Because the daily chart is in a trading range, the upside is likely limited as well. Even if the market reaches the April 1st high, sellers will probably be above.
- The bulls want last Friday to lead to a failed breakout below the April 11th low. Next, they want today to form a bull reversal bar that is closing near its high.
- Over the next several months, the Emini will likely test low. However, the bears still need to develop more selling pressure, which means that the market can rally above the April high before traders begin to sell.
Emini 5-minute chart and what to expect today
- Emini is up 44 points in the overnight Globex session.
- The Emin went sideways for most of the overnight session and formed an upside breakout during the 8:30 AM EST report.
- The bulls want today to form a strong bull trend day, which would create a bull reversal bar on the daily chart.
- The bears want the opposite and to create follow-through selling after last Friday’s bear breakout.
- More likely, today is going to disappoint the bears and lead to a bull reversal bar.
- Because the market will gap up, the odds favor a second leg up on the open. This means that traders should be mindful of this and expect the selloff to be brief.
- If today is going to be a trend day, the odds favor a bull trend because of the gap up.
Friday’s Emini setups

Al created the SP500 Emini charts.
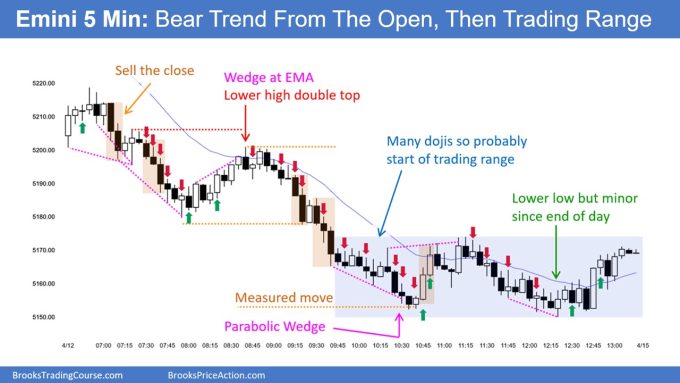
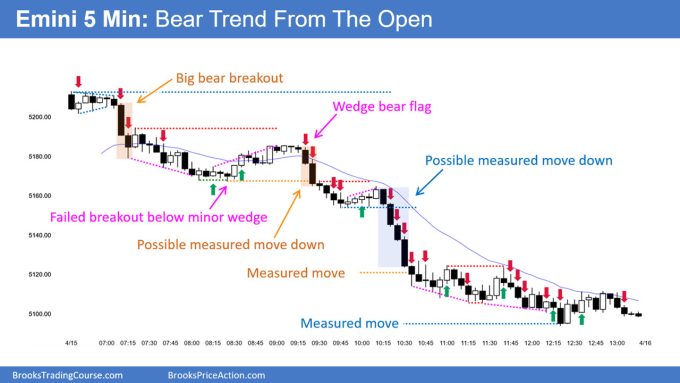
Here are reasonable stop entry setups from Friday. I show each buy entry bar with a green arrow and each sell entry bar with a red arrow. Buyers of both the Brooks Trading Course and Encyclopedia of Chart Patterns have access to a near 4-year library of more detailed explanations of swing trade setups (see Online Course/BTC Daily Setups). Encyclopedia members get current daily charts added to Encyclopedia.
My goal with these charts is to present an Always In perspective. If a trader was trying to be Always In or nearly Always In a position all day, and he was not currently in the market, these entries would be logical times for him to enter. These therefore are swing entries.
It is important to understand that most swing setups do not lead to swing trades. As soon as traders are disappointed, many exit. Those who exit prefer to get out with a small profit (scalp), but often have to exit with a small loss.
If the risk is too big for your account, you should wait for trades with less risk or trade an alternative market like the Micro Emini.
EURUSD Forex market trading strategies
EURUSD Forex daily chart
- The EURUSD formed a strong bear breakout bar last Friday. Last week’s selloff is strong enough for traders to expect a 2nd leg down.
- This means that the first reversal up is likely going to be limited and that there are likely sellers not far above.
- The bears are hopeful that the current downside breakout will lead to a measured move down of the past 5 months and test the October 2023 low.
Summary of today’s S&P Emini price action

Al created the SP500 Emini charts.
See the weekly update for a discussion of the price action on the weekly chart and for what to expect going into next week.
Trading Room
Al Brooks and other presenters talk about the detailed Emini price action real-time each day in the BrooksPriceAction.com trading room days. We offer a 2 day free trial.
Charts use Pacific Time
When times are mentioned, it is USA Pacific Time. The Emini day session charts begin at 6:30 am PT and end at 1:15 pm PT which is 15 minutes after the NYSE closes. You can read background information on the market reports on the Market Update page.


