- Market Overview: Weekend Market Analysis
- 30 year Treasury Bond futures
- Bond futures monthly chart is in 7-month tight trading range
- EURUSD Forex market
- EURUSD monthly chart had an outside down September at resistance
- EURUSD weekly chart is reversing up from last week’s bear breakout
- S&P500 Emini futures
- President Trump tested positive for Covid-19
- Monthly Emini chart had outside down bar in September
- Weekly S&P500 Emini futures chart has a weak High 2 buy signal
- Daily S&P500 Emini futures market has rally and possible double top with September 16 high
Market Overview: Weekend Market Analysis
The SP500 Emini futures daily chart reversed up from a small wedge bottom 7 days ago. However, September was an outside down bar on the monthly chart. That increases the chance of sideways to down trading in October. Traders believe that the Emini might go a little higher to the September 16 lower high next week, but that it will then turn down from a double top bear flag.
Bond futures have been in a tight trading range for 7 months. There is no sign that this is about to change.
The EURUSD Forex weekly chart reversed back up this week after last week’s strong bear breakout. However, it is still on a wedge top sell signal, and traders expect it to continue sideways to down for at least a few more weeks, even if it bounces for a week or two.
30 year Treasury Bond futures
Bond futures monthly chart is in 7-month tight trading range
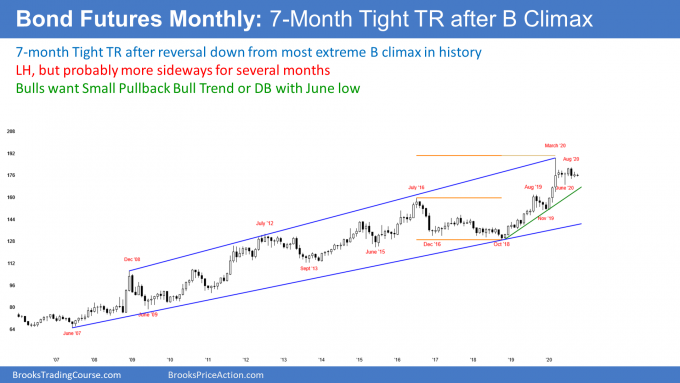
The monthly bond futures chart formed an inside bar in September. Its high was below the August high and its low was above the August low. Since August was an outside bar, there is now an ioi (inside-outside-inside) pattern. This is Breakout Mode. September is both a buy and sell signal bar.
The bulls see the 7-month tight trading range as a bull flag. They want October to resume the bull trend.
For the bears, the March reversal down was from the biggest buy climax in history. They see the 7 months since as a pause in the reversal down. They want the reversal to continue to the January 2020 buy climax low.
What is more likely? Since March, I said that the buy climax was so extreme that the bulls might not buy for 10 or more bars — about a year. I also said that the bull trend was so strong that the bears probably could not get a strong reversal down until they first stop the bulls for about 10 bars.
With neither the bulls nor the bears willing to be aggressive for a long time, I have been saying that the bond market was likely to stay sideways for about a year. There is no sign that this price action is about to end.
EURUSD Forex market
EURUSD monthly chart had an outside down September at resistance
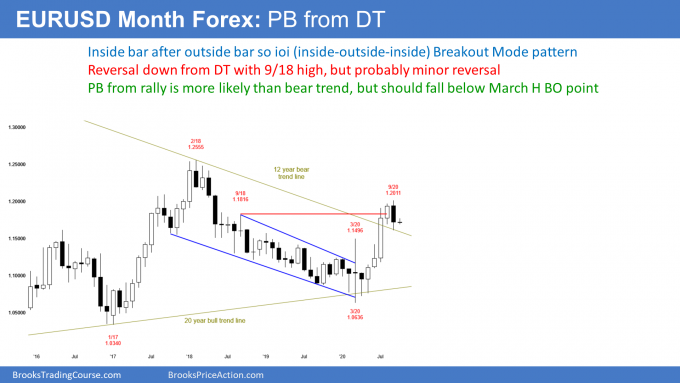
The EURUSD Forex monthly chart formed an outside down bar in September. There is also a double top with the September 2018 high. But this follows 4 strong bull bars. Therefore, bulls will buy a 1 to 2-month pullback.
Since the monthly chart has been in a trading range for 5 years, traders expect a pullback after a breakout. Therefore, the EURUSD will probably test down to the March 2020 high. That was the breakout point, and a pullback from a rally in trading ranges typically falls to at least a little below breakout point.
Does there have to be a pullback? No, but the selloff from the February 2018 high was a Spike and Channel bear trend. The bear channel began with the September 2018 high.
Once there is a break above the bear channel and a test of the start of the channel, the rally usually stalls. The market then typically enters a trading range. The bulls want a strong breakout above the prior high, and the bears want a reversal down from a double top with that high.
The market usually needs to see many bars before deciding on the direction of the next move. Consequently, the monthly chart will probably not race up or down.
September was an outside down bar at resistance
September was an outside down bar in a strong bull leg. That is not a strong sell setup. There are usually buyers around the low of the bar. If October falls below the September low, October will probably not form a big bear bar closing near its low. More likely, October would close back up at around the September low.
So far, October is within September’s range. An inside bar often follows an outside bar. That inside bar is a buy signal bar in a bull trend. It is also a sell signal bar for a double top with the September 2018 high. With both credible buy and sell setups, an ioi pattern (inside-outside-inside) is a Breakout Mode situation.
The March high is an important magnet below. Also, a rally after a Spike and Channel bear trend usually tests the start of the bear channel and then transitions into a trading range. Consequently, the EURUSD will probably be sideways to down for a month or two. But the bulls will buy the selloff.
EURUSD weekly chart is reversing up from last week’s bear breakout
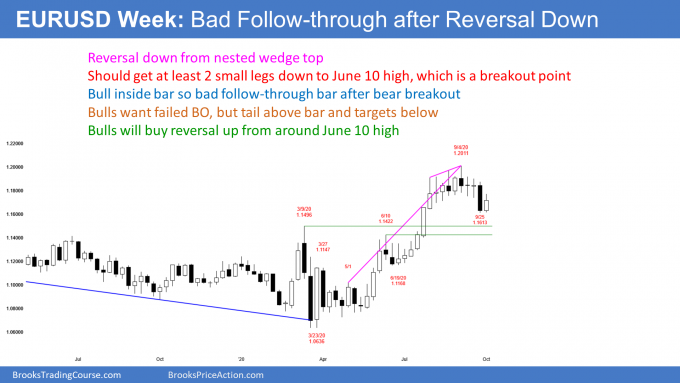
The EURUSD weekly chart had a bull inside bar this week. This is terrible follow-through for the bears after their big bear bar of the week before. It lowers the chances of a bear trend reversal after the wedge top.
However, traders still should expect at least a small 2nd leg down after a 4-month wedge top at resistance. Also, the breakout points of the March 9 and June 10 highs are magnets below. Therefore, while this week closed near its high and the bear breakout is failing, there will probably be sellers not too far above this week’s high.
What can the bulls do? If they get a break above this week’s high, they will trigger a weekly buy signal. However, that is not enough to convince traders that the bull trend is resuming. They need 2 or 3 consecutive bull bars closing near their highs or a strong break above the September high.
They have a 40% chance of success. There is a 60% chance that either the 2-month trading range continues for another month, or of a 1 to 2-week bounce to a lower high and then a 2nd leg down to the targets below.
S&P500 Emini futures
President Trump tested positive for Covid-19
Early on Friday, the White House announced that President Trump tested positive for Covid-19 and he is now having early symptoms. There is no way that this news helps the market. The question is whether it is a catalyst for a 2nd leg down from the September high. We will find out over the next few days.
Most people do not get symptoms for several days after getting infected. He might have contracted the virus on Saturday at an event for his Supreme Court nominee, Judge Barrett. At least 3 others from the event subsequently tested positive. These are Trump’s wife, the president of Notre Dame, and Senator Mike Lee, who at one point shook hands with Trump and neither were wearing masks.
Finally, 2 of Trump’s closest White House advisors, Hope Hicks and Kellyanne Conway, and his campaign manager, Bill Stepien, also tested positive this week.
It is interesting that Judge Barrett herself had Covid-19 this summer, but has since tested negative. She therefore was probably not the source of Trump’s infection. She presumably still has antibodies to the virus and therefore will probably not get sick from the event.
He probably was infected while on stage with Biden in the debate, and there is one report that he might have had early symptoms at that time. He gets tested every day, but it takes several days after exposure to have enough virus particles to cause a positive test. I want to believe that he tested negative on the day of the debate and not knowingly risked infecting others. Biden so far has tested negative.
Trump will get the world’s best treatment
If Trump is going to get very sick, we will know by early next week. It might take well into next week to know if this will interfere with his campaign and his re-election bid.
He is getting a high dose of Regeneron’s experimental drug, REGN-COV2. This is a monoclonal antibody cocktail containing antibodies from patients who recovered from Covid-19 and from mice that were given the viral spike protein. This drug is still in its clinical trials and it is unavailable to you and me. However, most agree that it is reasonable to let the president skip to the front of the line.
The early data from 275 of the 2,100 patients in the ongoing trial make the drug sound beneficial. The patients tended to have less severe symptoms and fewer virus particles, and they needed fewer office visits. Therefore, his risk of a severe infection is likely less than that for the average person.
But he is 74 years old and obese. That is never good with Covid-19. Also, he might have other medical problems, but we do not know since he hides his medical record.
The president is just not that important when it comes to the stock market
The market already knows that Biden is likely to win. That has been priced in. If the President gets very sick, his lack of campaigning will increase Biden’s chances. That might be somewhat bearish for the market. I say “somewhat” because the market rallied much more strongly under Clinton and Obama than under Bush or Trump.
The president is just not that significant when it comes to the market. The market is much bigger than just one person. However, Fed Chair Powell is critical. He has promised to “print infinite money” to prevent a big selloff. No president can do that, and that is much more important than anything any president can say or do.
The market is reacting to technical factors more than to the presidential election
Traders must understand that there are technical factors that are more important than this news. For over a month, I have been saying that the Emini will probably fall below the July 30 low. That was the bottom of a streak of 9 consecutive bull days. When there is an extreme buy climax like that, traders expect a reversal down to below its low.
Also, if the Emini gets there, it will have to break below the September 24 low. That is the neckline of the double top created by the September 16 high and this week’s high. A measured move down is around the 3000 Big Round Number, the June trading range low, and a 20% correction.
The market already has a bearish technical picture for the next month, but it has been waiting for an excuse to go down to the targets below. A sick president could be that excuse.
I keep reminding traders that the market always has a 40% chance of doing exactly the opposite of what you might believe. Therefore, if it rallies strongly next week to above the September 16 high, traders will buy, regardless of the news out of Washington. Price is truth.
Monthly Emini chart had outside down bar in September
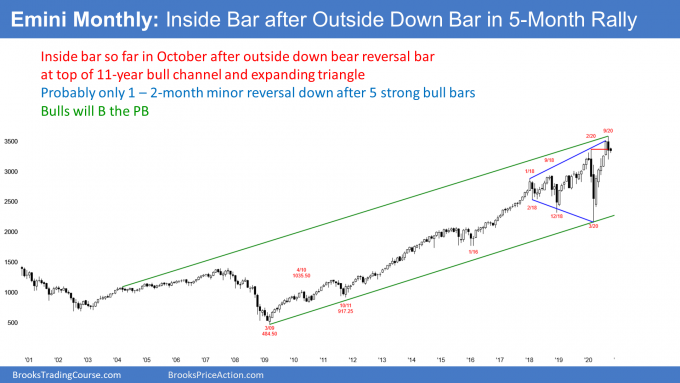
The monthly S&P500 Emini futures chart had a big bear outside down bar in September. The September high was above the August high and its low was below the August low.
While it had a big bear body, the close was far above the August low. It is therefore not nearly as bearish as it could have been. Moreover, it followed 5 strong bull bars. This is bad context for traders looking for a bear trend reversal.
The 5 big bull bars reversed up from a dramatic sell climax in March. When there is a big reversal after a big selloff, traders expect at least a small 2nd leg up. Consequently, they are planning to buy the 1st reversal down. That pullback is often called the handle in a cup and handle bottom. The selloff and reversal up formed the cup.
What happens after an outside down bar?
When there is an outside down bar in a bull trend, traders expect the market to go sideways to down. So far October is within the September range. It is therefore an inside bar after an outside bar.
If October remains an inside bar, there will be an ioi (inside-outside-inside) pattern on the monthly chart. That is a Breakout Mode situation. October would be both a buy and a sell signal bar.
For the Bulls, October would be a High 1 bull flag in a bull trend. The bears, however, see it as a pause after September’s reversal down. It would be both a Low 1 sell signal bar and an ioi top sell signal bar.
Breakout Mode patterns are often 50-50. In this particular case, if October remains an inside bar, the ioi would be coming in a buy climax at resistance. There would make the probability of a bear breakout slightly higher.
What happens above or below September?
If October goes above the September high, it will probably not get far. There will probably be sellers above a bear bar in a buy climax at resistance.
But what if October falls below the September low? That would trigger a minor monthly sell signal. Traders would expect at least slightly lower prices for a month or two.
If October was a big bear bar closing on its low and far below the September low, traders would expect at least a 50% selloff. That type of bar is unlikely, given how strong the bull trend is and how weak the outside down bar is.
Most likely, October will either remain an inside bar or it will go below the September low. If it goes below the September low, it will probably not close far below the September low. That would be bearish and therefore that is unlikely.
Instead it would probably close around the September low. If it closed a little below, traders would expect maybe slightly lower prices in November. But if it were to close above the September low, traders will expect more sideways trading in November. This is especially true if October closed far above the September low.
Minor trend reversal likely
If October goes below the September low, it will trigger a minor sell signal. There is a buy climax at the top of a 3-year trading range and at the top of a 16-year bull channel. The reason why I am calling this a minor reversal is that the bulls will buy the selloff. Therefore instead of a major trend reversal into a bear trend, the selloff should be a bull flag.
How far down can the reversal go? Every trader’s first reaction is 50%. In strong bull trends with weak tops, they look for less. With strong tops, they look for more. The Emini has stopped going up in September, but it has not yet begun to go down on the monthly chart. The 50% retracement level is 2926.50. There are other targets on the weekly and daily charts and I will discuss them below.
Weekly S&P500 Emini futures chart has a weak High 2 buy signal
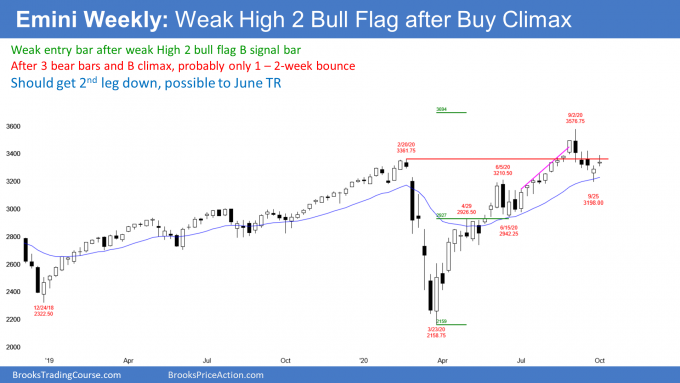
The weekly S&P500 Emini futures chart triggered a High 2 bull flag buy signal this week by going above last week’s high. The buy signal was not strong. Last week was a small bull bar that followed 3 bear bars and a buy climax. This buy signal will probably lead to a bounce and not a resumption of the bull trend. The sellers should return within a couple weeks.
What happens if next week is a 3rd consecutive bull bar? Then traders will expect more sideways to up trading during the following week.
What if next week is a big bull bar closing on its high and far above the minor lower high from 2 weeks ago? Then traders will expect a test of the September all-time high.
Daily S&P500 Emini futures market has rally and possible double top with September 16 high
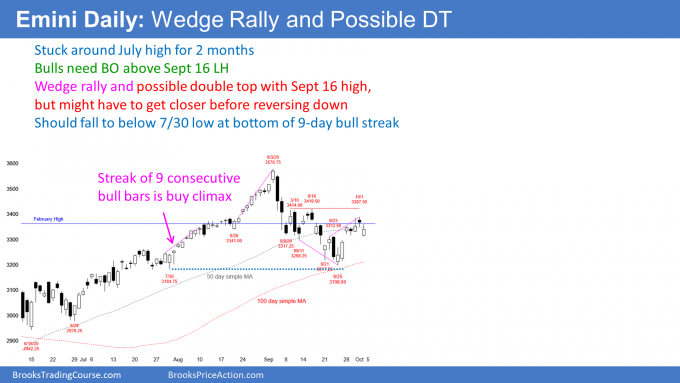
The daily S&P500 Emini futures chart has been sideways around the February high for 2 months. Remember, it collapsed from that price in February. Also, although August broke far above that high, the breakout failed. Traders are taking a long time deciding if it is unenterable resistance. If so, the Emini will sell off and then the bulls would try again in a month or two.
The Emini formed a small wedge bottom on September 24. At that time, I said that it should reverse up and test the start of the wedge selloff, which was the September 16 high.
The Emini is around that price now. Traders will decide over the next few days if the Emini will break strongly above that lower high and continue up to test the all-time high. The bulls currently have a 40% chance.
The bears should sell some time next week. For them, the rally from the September 21 low is a wedge bear flag and it is forming a double top with the September 16 high. They want a reversal down to below the September 24 neckline of the double top and a measured move down.
That would be around the June trading range, which is a possible Final Bull Flag and a magnet. It is also around the other magnets of the 3000 Big Round Number, a 20% correction, and a 50% retracement of the 5-month rally.
The correction probably has more to go
What are the odds of a break below the September low before there is a new high? It this particular case, the probability is currently 60%.
Why so high? Because there was a streak of 9 consecutive bull bars that started in late July. A streak like that is rare and therefore climactic. When there is a reversal down from an extreme buy climax, the selloff usually continues to at least a little below the start of the buy climax.
That is the July 30 low of 3184.75, which is below the September low of 3198.00. If it gets there, traders will look for a measured move down from the September trading range to the targets around 3000.
Trading range price action will change soon
It is important to understand the price action over the past month. All through September in my trading room, I said that the selloff looks like a leg in a trading range and not the start of a bear trend. That is why I kept saying that it should bounce back to above 3400.
After the 1st 2 big bear days in early September, the bars were mostly small with prominent tails. Furthermore, there were reversals every few days and there were several bull days. That is a market that lacks conviction.
While the trading range from 3200 to 3400 could continue for another month or more, it probably will not. It will end with a breakout up or down. Down is more likely. The breakout will have 2 or more consecutive big bear bars or 3 or 4 consecutive smaller bear bars. Both represent a consensus that the market is headed lower. That is trending price action.
Trading Room
Traders can see the end of the day bar-by-bar price action report by signing up for free at BrooksPriceAction.com. I talk about the detailed Emini price action real-time throughout the day in the BrooksPriceAction.com trading room. We offer a 2 day free trial.
Charts use Pacific Standard Time
When I mention time, it is USA Pacific Standard Time (the Emini day session opens at 6:30 am PST, and closes at 1:15 pm PST). You can read background information on the intraday market reports on the Market Update page.

