Weekend report co-author Andrew A.
Market Overview: Weekend Market Analysis
The SP500 Emini futures reversed up from an Emini double bottom bull flag this week on the daily chart. But it has been sideways for a month. Traders are waiting to see if August will have a bear body on the monthly chart. If it does, especially if it closes near the low of the month, it will probably be the start of a 15- to 20% correction.
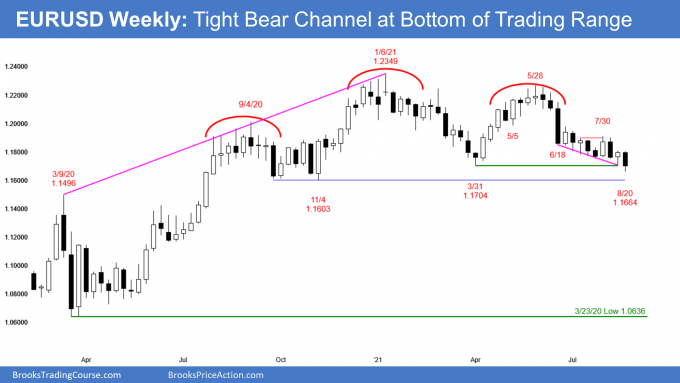
The EURUSD Forex continue to trade lower in a tight bear channel but with many overlapping bars. Bears are looking for a test of the November lows while the bulls are looking to see if there will be strong profit taking around the lows of the broad yearlong trading range. With reversals coming every week or two, there should be a bounce this week.
EURUSD Forex market
The EURUSD weekly chart

- The EURUSD Forex weekly bar traded below last week’s low and closed slightly below March’s low.
- Last week’s High 2 bottom buy signal did not trigger as the bulls failed to push EURUSD above last week’s high.
- There was no follow-through selling following Thursday’s breakout below March’s low (daily chart, not shown).
- Friday was a bull bar on the daily chart, and therefore a buy signal bar for a possible bounce. The bulls want a test of the August 13 high.
- This week’s bar has a large bear body therefore is a weak buy signal bar for a strong reversal up. However, with reversals every week or two, the coming week should bounce.
- There are tails below the weekly bars indicating that bears are using new lows to take profits instead of opening new shorts.
- Since near the bottom of the yearlong trading range, EURUSD can reverse up sharply at any time. Traders need to see consecutive big bull bars closing on their highs before they conclude that a reversal up will be more than a pullback in the bear channel.
- Bears want strong breakout below yearlong trading range and 700-pip measured move down, but more likely there will be buyers below November low.
- While not a strong bear trend since June 25 high, the November low is a magnet.
- Traders also know that breakouts from trading ranges fail most of the time. Markets have price inertia and tend to continue what they have been doing. Therefore, the yearlong trading range is likely to continue. That means there should be a rally for a couple months beginning around the current level or from just below the November low.
S&P500 Emini futures
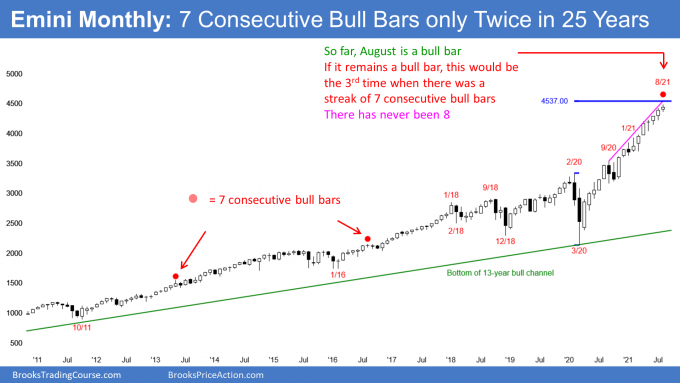
The Monthly Emini chart

- So far, August is a small bull bar with small tails on top and below.
- If it remains a bull bar, this would be the 3rd time in the 25-year history of the Emini when there was a streak of 7 consecutive bull bars.
- There has never been a streak of 8 consecutive bull bars so August or September should be a bear bar.
- If either of them is, the yearlong rally will be a parabolic wedge. That should lead to 2- to 3-months sideways to down profit taking.
- But, because the bull trend is so relentless, traders will buy the Emini pullback, even if it is 20%.
- The bears have not yet been able to create a bear bar or even a bull bar with a prominent tail on top for 6 months.
- Sometimes in a buy vacuum, sellers stop selling until the price reaches a measured move or other resistance.
- The next measured move is 4537 based on the height of the pandemic crash.
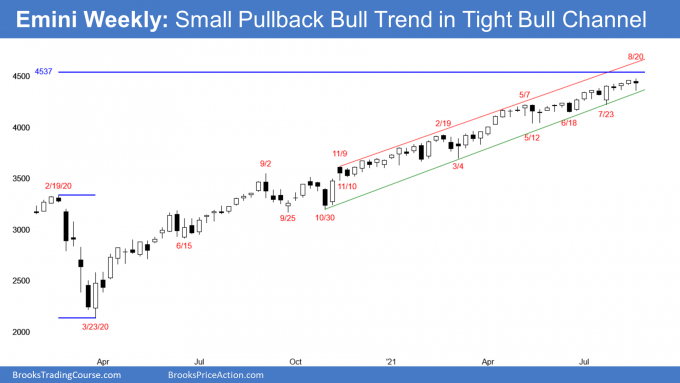
The Weekly S&P500 Emini futures chart

- The Emini weekly candlestick bar was an outside down doji bar.
- It is therefore neutral. This increases the chance of next week being a 3rd mostly sideways week as we get near the important close of the month.
- The Emini tested near the bottom of the bull trend line around 4360 and reversed up.
- The next targets for the bulls are the 4537 measured move (based on the height of the pandemic sell-off) and the top of the weekly trend channel line at around 4600.
- This week could be the pullback the bulls needed before they attempt to test the top of the weekly channel.
- The Emini has been in a Small Pullback Bull Trend for more than 60 bars, which is unusual, and therefore unsustainable and climactic.
- A Small Pullback Bull Trend ends with a big pullback. The biggest pullback so far was the 10% selloff in September. A bigger pullback means 15 to 20%.
- The bears have not been able to create consecutive big bear bars.
- While there is a bear body and small tail above this week’s bar, the bar closed in the upper half of the week’s range, therefore the bulls are still buying.
- The rally is in a tight bull channel, which is also a sign of strength for the bulls.
- Until the bulls aggressively take profits, the bears will not sell. The bears need to see one or more big bear bars before they will look for a 2- to 3-month correction.
- Until then, traders will continue to bet on higher prices and that every reversal attempt will fail.
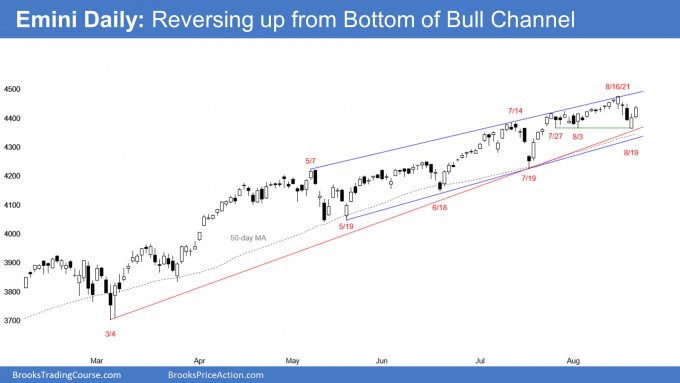
The Daily S&P500 Emini futures chart

- The Emini tested the August 3 low, which was the start of the bull channel after the spike up from the July 19 low.
- The bulls want the reversal up to break to a new high, which is the neckline of the double bottom. They then would hope for a measured move up.
- When a Spike and Channel Bull Trend tests the start of the channel, there is usually a bounce and then a trading range.
- The Emini also tested the 50-day simple moving average and the bottom of the bull channel, but did not reach either. It might have to go at least a little below both before the bulls become confident that support has been adequately tested.
- The bears were not able to create follow-through selling after the selloff early in the week.
- The top of the Trend Channel Line around 4500 is a magnet.
- The bull trend is strong, and therefore traders expect the Emini to test the top of the bull channel.
- If there is a breakout above the channel, the Emini will probably start to reverse back down to the middle of the channel within about 5 bars after the breakout, like what happened with the August 16 breakout above the channel.
- The bears want a lower high on the daily chart and then a 2nd leg down. They also will try to make the month close below the open. It would then have a bear bar on the monthly chart, which would make 2- to 3-months of profit-taking likely.
- While the trend has been overextended and extreme, bulls continue to bet on higher prices because they know that in a strong trend, most reversal attempts fail.
- Traders need to see aggressive profit-taking and consecutive strong bear bars before they will be willing to short aggressively. Traders will not believe a correction is underway until it is already about half over.
Trading Room
Traders can see the end of the day bar-by-bar price action report by signing up for free at BrooksPriceAction.com. I talk about the detailed Emini price action real-time throughout the day in the BrooksPriceAction.com trading room. We offer a 2 day free trial.
Weekly Reports Archive
You can access all weekly reports on the Market Analysis page.

