Market Overview: Weekend Market Analysis
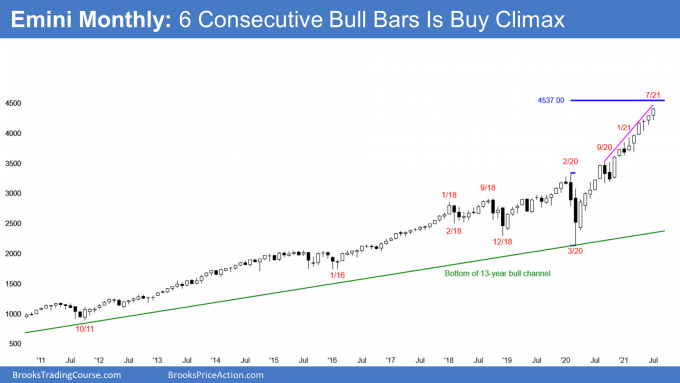
The SP500 Emini futures market rallied strongly this week and formed an outside up bar on the weekly chart. The bulls want July to be the 6th consecutive bull bar on the monthly chart when the month ends of Friday. That has not happened in 10 years.
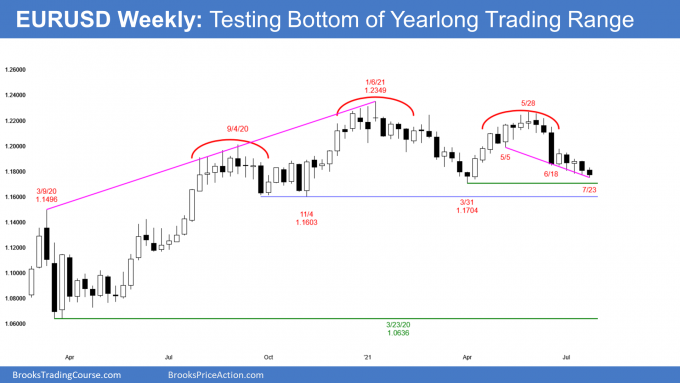
The EURUSD Forex market has been selling off in a 9-bar bear micro channel. The bears want a break below the March low and then below the November low, followed by a measured move down. If there is a reversal up from the wedge bear channel, the 1st rally will probably be minor.
EURUSD Forex market
The EURUSD weekly chart

- Every high for the past 8 weeks has been below the high of the prior week.
- This is a 9-bar bear micro channel, and it is a sign of relentless selling. Traders will probably sell the 1st reversal up.
- Many bulls will wait for a micro double bottom before buying again. This limits the upside potential over the next few weeks. The best the bulls will probably get is a bounce to the June 25 high at around 1.20.
- The bulls hope that the selloff from the May high is just a deep pullback from the rally that began in March. They see it as a wedge bull flag that began either with the May 5 low or the June 18 low.
- The bears want the selloff to break below the bottom of the yearlong trading range, which is a head and shoulders top. That is the November low at 1.1603.
- They then want a 700 pip measured move down to last year’s low.
- However, trading ranges resist breaking out. Consequently, if there is a break below the November low, it will probably fail within a few weeks.
S&P500 Emini futures
The Monthly Emini chart

- July so far is the 6th consecutive bull bar. The open of the month is probably too far down for the bears to get there this week, although Wednesday’s FOMC announcement is a potential catalyst.
- The would be the 1st time in 10 years when there was a streak of 6 consecutive bull bars on the monthly chart.
- A 7th would be even more rare, which makes it likely that August will have a bear body.
- That would be the 3rd reversal attempt in a yearlong tight bull channel, and therefore a parabolic wedge top.
- After a bear bar, traders should expect a 15-20% correction over the following couple months.
- The next target for the bulls is 4,537, which is a measured move up based on the height of the pandemic 2-month collapse.
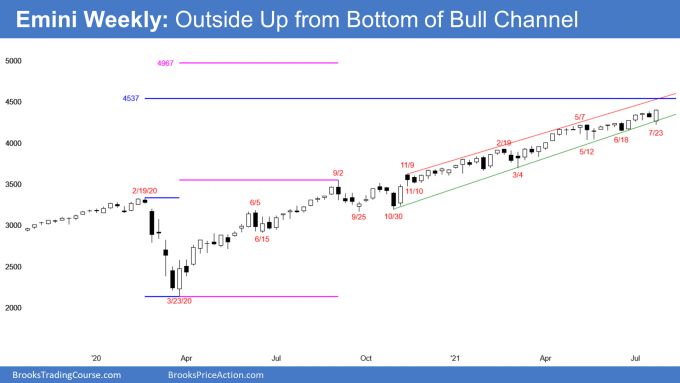
The Weekly S&P500 Emini futures chart

- The weekly chart has been in a Small Pullback Bull Trend for over a year.
- There is no sign of a top, but most Small Pullback Bull Trends begin to evolve into a trading range once they last more than 60 bars. Therefore, traders should expect a couple months of sideways to down trading starting at any time.
- Until it comes, traders will continue to bet on higher prices. Buy climaxes can last much longer than what might seem reasonable.
- This week traded below last week’s low and then above its high. It was therefore an outside up week.
- Because it closed above last week’s high, it is a stronger bar. This increases the chance of higher prices next week. This week might gap up.
- An outside up bar means there are 2 bars that are sideways. That increases the chance that next week will also have a lot of overlap with this week. This is true even if next week breaks above this week’s high.
- In fact, there are 4 sideways bar. That is further evidence that traders see the area just below 4,400 as fair. It increases the chance that next week might not go much higher.
- The bar after an outside bar often is an inside bar. Instead of strong follow-through buying, the new bar fails to get above the outside bar.
- If its low is above the low of the outside bar, then the week is an inside bar. An inside bar after an outside bar is an ioi (inside-outside-inside) Breakout Mode Pattern.
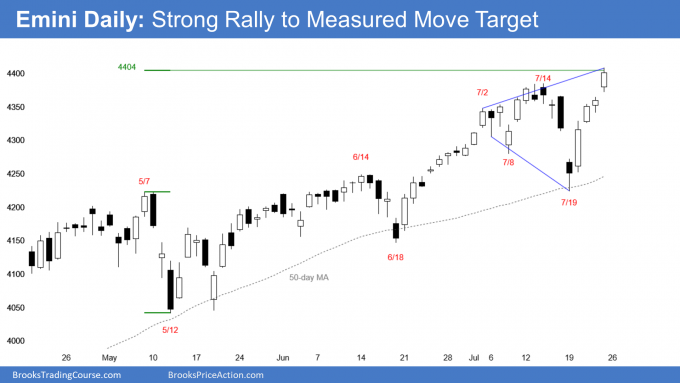
The Daily S&P500 Emini futures chart

- 4 consecutive bull bars.
- Breakout to new all-time high.
- Breakout above 4,400 Big Round Number.
- Reached 4,404 measured move target, based on April to June trading range.
- Next target is top of bull channel, just above 4,500.
- No sign of a top. Traders will continue to buy 1- to 3-day selloffs, even when strong, like on Monday.
- The bears will need at least a micro double top before they can get more than a 3-day pullback.
- If there is a reversal down within a couple weeks, it will be from an expanding triangle that began with the July 2 high.
- That is a type of major trend reversal, and like all major reversal patterns, it would have a 40% chance of a swing down. A swing down means at least 2 legs and about 10 or more bars.
- A good looking major trend reversal pattern has a 30% chance of actually reversing a bull trend into a bear trend.
Trading Room
Traders can see the end of the day bar-by-bar price action report by signing up for free at BrooksPriceAction.com. I talk about the detailed Emini price action real-time throughout the day in the BrooksPriceAction.com trading room. We offer a 2 day free trial.
Weekly Reports Archive
You can access all weekly reports on the Market Analysis page.

