Market Overview: Weekend Market Update
The Emini will probably form a higher low after the extreme sell climax in March. The 1st target is 2706.00, which is 20% down from the high. Last week is a sell signal bar on the weekly chart. But there will probably be buyers below its low for a 2nd leg up on the daily chart.
The bond futures market is bouncing from the first reversal down from a buy climax. Traders should expect a lower high and a 2nd leg sideways to down.
The EURUSD Forex market has had many big legs up and down in recent weeks. It will probably be sideways for at least a couple more weeks.
30 year Treasury bond Futures market:
Rally to a lower high after a buy climax
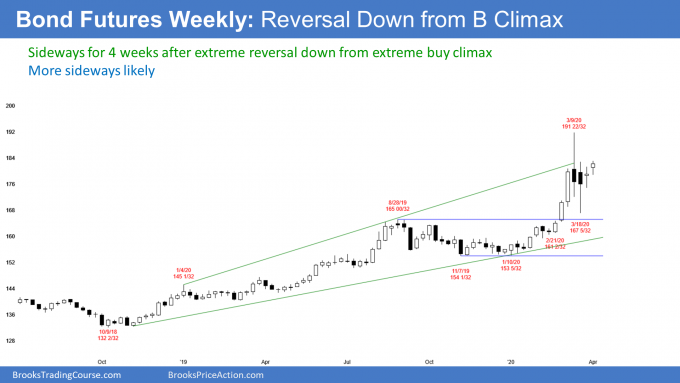
The 30 year Treasury bond futures pulled back for the past 3 weeks from the most extreme buy climax in its history. By going above last week’s high, the weekly chart triggered a High 1 bull flag buy signal this week.
But last week was only a doji bar, which is a weak buy signal bar. That lowers the probability of s significant rally.
Also, the doji followed 2 huge bars with bear bodies. Those bars formed the big reversal down. They create a bad context for bulls looking for an immediate resumption of the bull trend.
What do the bulls want to see?
When there is an extreme buy climax like that, the bulls take profits and then wait. They are not looking to buy again just 3 bars later. If that was their thought, they would not have exited.
Because those big bear bars told us that many big bulls exited, traders expect more of a pullback before the bulls will return. My typical guide is TBTL, Ten Bars, Two Legs. Also, I want to see a test down to support, like the 20 week EMA, a breakout point, a bull trend line, or a prior higher low.
Why 2 legs sideways to down? The bulls want to give the bears at least a couple chances to reverse the bull trend into a bear trend. If the bears fail twice, then the bulls will look to buy again. That is how a High 2 bull flag is created. If the bears fail 3 times, there is then either a triangle or a wedge bull flag.
The bulls will want evidence that the bears are giving up. They especially like to see several bull bars closing near their highs. Also, they prefer a buy signal bar with at least an average size body and closing near its high.
Another sign that the bears are weak and that the bulls are still strong is if the pullback that holds support. Examples include the EMA, a breakout point, a bull trend line, or a prior higher low or a double top.
This pullback from the high has more to go
This pullback is early and there is still work to do. The pullback so far was only 1 week, and there are now only 3 sideways weeks since the high. Traders want to see a longer pullback, like about 10 bars. They also want to see 2 – 3 legs of sideways to down trading. This pullback has not met these objectives.
The candlestick from 2 weeks ago was huge and it had a big tail below. The low held above the August 28 breakout point. That candlestick was a successful breakout test. The big tail on the bottom of the candlestick means that the bond futures got near that breakout point, but then reversed up sharply. That is good for the bulls.
However, the pullback has not reached the EMA, which is a magnet below. Also, it did not test the bottom of the most recent buy climax. That is the low of those 3 big bull candlesticks in late February.
While the bond futures can still trade higher for another couple of weeks, there will probably be a lower high. Traders expect more sideways to down trading before considering buying aggressively again.
What about a bear trend instead of a pullback?
It is important to note that the trading range will form some kind of major trend reversal sell signal. For example, there might be a lower high or a wedge rally to a double top.
If these form, then the bears will have a 40% chance of beginning a bigger correction. Their 1st target would be the November low That is the bottom of a 4 month triangle.
A triangle late in a bull trend is an area of agreement. If the bulls break above it, as they have, the market usually sees the price as too high. Traders expect a pullback to the apex of the triangle. Consequently, there will probably be a pullback to the 154 area at some point this year.
EURUSD weekly Forex chart:
Repeated big reversals make more sideways likely
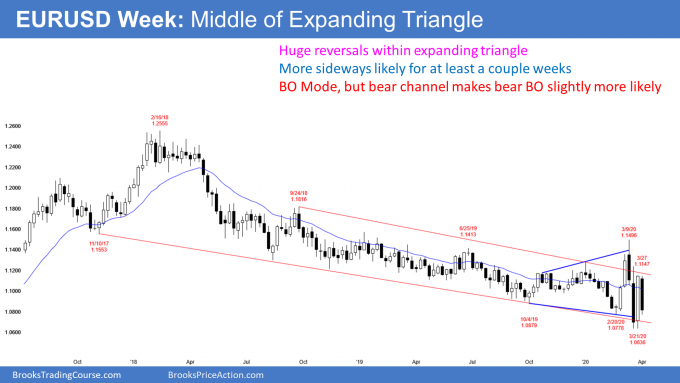
The EURUSD weekly Forex chart has had many abrupt reversals over the past 6 weeks. Traders are deciding if the 2 year bear trend will continue to below the January 2017 start of the bull trend. If it does, traders will then expect a test of par (1.0).
The alternative is a reversal up from the 2 year bear trend. The bulls want a successful breakout above the 20 month bear channel and a rally back to the start of the channel. That is the September 2019 high, which was the top of the first strong bounce after the sharp bear breakout in April 2017.
Which is more likely? You tell me. When the market is repeatedly reversing and the reversals are abrupt and big, neither the bulls nor the bars can maintain control. They both take quick profits because they believe that another reversal is more likely than a successful breakout of the 8 month trading range.
Because the trading range is in a 2 year bear trend, there is always going to be a slightly higher probability of a bear breakout. But the EURUSD would not be going sideways if the bears had a significant advantage. It would be selling off relentlessly.
Markets have inertia. There is a strong tendency for a trend to continue. But there is also a strong tendency for a trading range to continue as well. As a result, no matter how strong the legs up and down have been over the past couple months, each has reverse.
March was a huge doji candlestick on the monthly chart
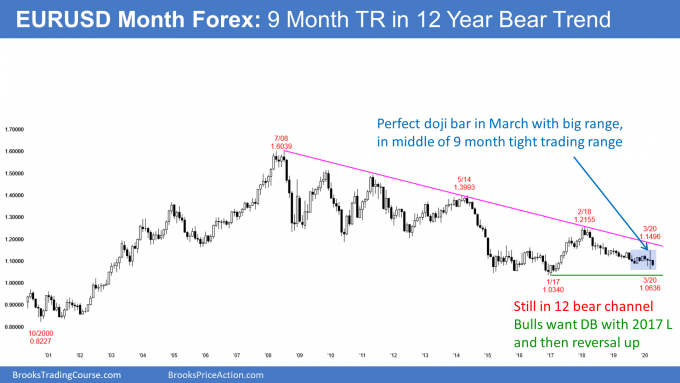
The monthly candlestick in March was huge. It broke above and then below the 20 month bear channel. It then closed almost exactly where it opened, which was the middle of the 8 month tight trading range.
That big doji bar in March is a sign that the EURUSD is intensely neutral. Consequently, April will probably be sideways as well. Since April open in the middle of March’s huge range, April will probably not break out of that range. It would then be an inside bar after an outside bar.
Since the bar before an outside bar is within the range of the outside bar, the sequence is inside-outside-inside. This is an ioi pattern. That means the market is perfectly balanced and in breakout mode.
When the market is in Breakout Mode, there is a 50% chance of a successful bull breakout and a 50% chance of a successful bear breakout. Furthermore, there is a 50% chance that the 1st breakout will reverse.
Even if April goes beyond the March range, it will probably not get far above or below. It has opened in the middle of the March range. Therefore, if it breaks out, it will mostly overlap March. That would be a continuation of the 8 month range.
Traders expect more sideways trading next week
What will traders expect next week? The same as they have for months. If the EURUSD goes down, they will look for it to reverse up. If it goes up, they expect it to reverse down. Until there is a breakout, there is no breakout. Traders will continue to bet on reversals until there is clear breakout.
Coronavirus: The pandemic is an excuse, not the fundamental problem
I want to repeat a point that I have made several times. The charts over the past 2 1/2 years have told me that the bull trend was ending. It is easy to say that the pandemic took a good economy and made it bad. That is not what happened.
The pandemic came during a sick stock market. It started an unwinding that was going to happen soon anyway even without the pandemic.
How do I know? The pandemic will be over in a couple years. Let’s see if the stock market is far above the February high in 3 – 5 years. It won’t be, and people won’t have the pandemic to blame anymore. They then will have to begin to accept that the economy was in trouble since late 2017, not since February 2020.
The pandemic math is telling a different story
Dr. Fauci said that the best case is that we will lose 100,000 people. With a death rate of 1 – 2%, that means we will have about 10 million infected. A big number, but is it really?
There are over 300 million people in America. That means he is thinking that only 3% of the country will be infected. Does anyone really believe that a 3% problem caused the stock market to fall 35% in a month? The behavior of the American people and of the economy is telling us that the problem is much bigger than a 3% pandemic.
I have 2 explanations. First, his best case scenario could be absurd. Past pandemics have infected 20 – 50% of a population. If that happens here, then maybe a million people will die. I have looked at the charts and I understand how he gets 100,000. I agree that it is reasonable to estimate that only several hundred thousand people will die in the US. That still does not eliminate a third of the country’s wealth in a month.
My 2nd explanation is more important
My other explanation is the one I keep saying, but so far, I am the only one. That is that there have been serious problems in the economy since 2017 that have been hidden by the residual momentum of a decade-long bull trend.
The pandemic is lifting the lid and now people are beginning to discover what is really under the surface. They see a stock market pumped up by stock buybacks, government and corporate debt, and ridiculous policies. And they are afraid that this is a weak foundation to support a rally to the highs in February.
That means that the decade-long bull trend was doomed to end with or without a pandemic. There is always a trigger. If it was not coronavirus, it would have been something else.
But what happens long after the pandemic is gone and the stock market is still floundering? Everyone will come to accept that the problem was the economy and not the pandemic. They will then conclude that this is a secular (decade long) bear market and not just the usual 1 – 2 year cyclical bear trend within a secular (decade long) bull market.
The Economy: The Fed is everyone’s insurance policy
I said that traders believe that the Fed will prevent a free-fall. Sometimes you will hear that the Fed is a “put” under the market. By that, traders mean that the Fed will act like a put option for your account. They will protect everyone’s portfolios from horrendous losses.
Traders see the Fed as guaranteeing that selloffs will not get too big. The Fed is the market’s insurance policy. How big is too big? The biggest selloffs since WWII were about 60%. Traders will bet that the Fed will use that as its benchmark.
How to trade using the Fed
It is important to remember why the Federal Reserve was created. It exists to maintain a stable and growing economy through price stability and full employment. The Fed governors are the best people in the country in terms of both intellect and integrity. If we are going to trust anyone, we are going to trust them.
I said that traders believe that the Fed will prevent the market from falling below some undisclosed level. That has created a sense that a trader can buy at any time and safely buy more lower, trusting that the Fed will protect them.
Let me tell you a secret. That undisclosed level is around 60%. Why? Because that has been around the biggest selloff since the Great Depression. The Fed knows that if it allows a bigger selloff, there could be tremendous panic and damage to the economy. They would violate their mandate.
At what level is it safe to buy?
With many traders confident that the market will not fall much below 60%, they know that there will be lots of buyers somewhere above the 60% level. No one ever knows how far a selloff will fall, but if you are confident that 60% is the floor, you might be inclined to start buying when the market is down 30 or 40%. Then buy more at 50 or 60%, betting on a strong bounce off the Fed’s secret floor.
What happens if I am wrong and the floor is 70%? It might be, but the principle is the same. The Fed will create a floor. They said essentially that they will print “infinite dollars” to protect the economy.
Traders also believe that the Fed will use some of that money to buy ETFs, if necessary, to stop a collapse. If it buys ETFs, it would essentially be buying a broad basket of stocks. The market is made up of stocks. If there is strong buying, the market will go up.
Can the Fed fix this mess?
No. The damage that the economy has suffered is broad and deep. It is as if an Olympic sprinter broke both legs and his pelvis in a car accident. The doctor might save his life, but he’s not going to be winning gold medals any time soon. The sprinter has to heal himself. The doctor has no magic that immediately makes him normal again.
Remember, the Fed’s mandate is to maintain a stable economy. That means it exists to prevent disaster. It does not exist to take a horribly damaged economy and quickly make it normal. It could not do that even if it wanted to. The Fed is simply trying to prevent a bad situation from getting worse.
It cannot turn that terrible economy into a good economy. The economy has to heal itself. The stock market was the most overbought in its history. It will take a decade for the fundamentals to catch up with price.
Monthly S&P500 Emini futures chart:
Bull inside bar after extreme sell climax
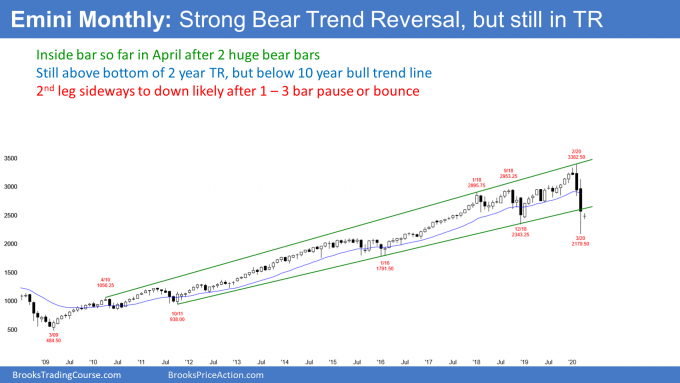
The monthly S&P500 Emini futures chart so far in April has a small bull bar. It is within March’s range and it is therefore a bull inside bar.
February and March were huge bear bars. It is important to note that March had a big tail on the bottom of its candlestick. Furthermore, after March broke far below the 11 year bull trend line, it closed almost back to that line. In addition, it briefly broke below the 2 year trading range, but closed significantly above the December 2018 bottom of the range.
This strong buying makes it likely that the 2 year trading range will continue for a least another month or two. It might even continue all year.
Expect big correction after biggest buy climax in history
At the top of the 2017 buy climax, I said that the Emini’s strong bull trend would soon end. I wrote that rally in 2017 was the most extreme buy climax in the history of the stock market on the daily, weekly, and monthly charts.
The price had gotten far ahead of the fundamentals and the rally was unsustainable. The two years of chaos that followed indicated that the bulls were just not able to extend the buy climax any further. The rally had to end.
When a bull market ends, the market sometimes quickly reverses into a bear trend. Much more often, it enters a trading range. That trading range can last 50 to 100 bars when the buy climax is extreme. On the monthly chart, that means a decade.
Trading range for the next decade
I have repeatedly written for more than 2 years said that the 2020’s will probably be mostly sideways. Traders should expect it to resemble the decades that followed the buy climaxes of the 1960’s and 1990’s. Both of those trading ranges lasted about 10 years.
There were at least a couple 40 – 60% pullbacks. There were also rallies that lasted as long as 5 years. But, the market remained sideways. It failed to break far above prior highs or far below prior lows. That is what is most likely going forward.
The range will probably be approximately between 1800 to 3600. Traders will buy selloffs, especially since the Fed essentially made it clear that they will prevent a free-fall. More on that below.
A lot of supply above
But what happens if there is a new high? The Fed certainly would not stop it. What, then, would? There is a huge supply of stock around the February high. All of the bulls who did not exit have been shocked by the ferocity of this selloff. They do not believe that there will be a big new high anytime soon.
They correctly believe that the 12 year bull trend has ended. The market is now in either a bear trend or a trading range. In either case, they know that it makes sense to exit or even short on rallies. Many therefore are eager to exit their positions up near the old high. This would reduce their current loss.
Also, the bears see how strong the selloff was from around 3400. If the Emini gets back there, they will aggressively sell, betting that lots of other traders will again sell there.
Traders expect that there are so many bulls and bears eager to sell around the old high that the first rally up there will probably reverse down. The result of the supply at the old high and the Fed protecting the downside will be a trading range.
At least 3 years before test of old high
Once the S&P500 cash index closes 20% down from the all-time high, it is in a bear market. The average bear market lasts over a year. It usually takes 2 more years before there is a new high. That is what is typical.
But this selloff was far stronger that the typical initial selloff in a bear market. Traders should assume that the recovery will take much longer.
Does that mean 5 years instead of 3? Who knows? But I do know that it took about 10 years in the 1970’s and again in the 2000’s. Therefore it is reasonable to assume it will take about that long this time as well.
There are always many other possibilities. At the moment, there is a 30% chance that the bull trend will resume and the stock market will be far above the old high within a few years. But that means there is a 70% chance it will not.
Weekly S&P500 Emini futures chart:
Weak buy signal triggered this week
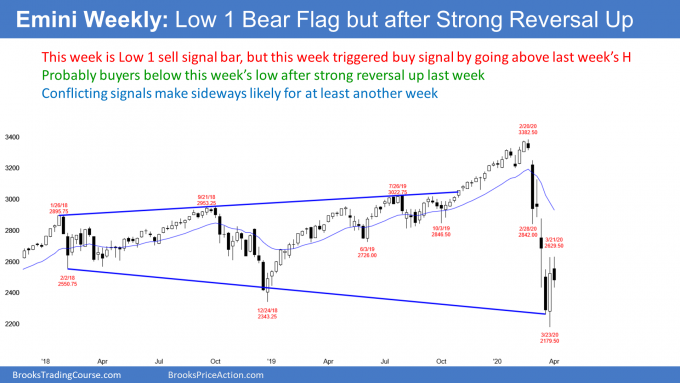
The weekly S&P500 Emini futures chart reversed up last week from an expanding triangle that began with the January 2018 high. Last week was a big outside up bar and it was therefore a buy signal bar. The weekly buy signal triggered this week when this week traded above last week’s high.
But last week’s candlestick had a big tail on top. That indicates selling at the end of the week. It is a sign that the bulls were not nearly as eager and confident as they could have been.
Also, it closed below the high of the week before. If the outside bar closed on its high and far above the high or the prior week, traders would have seen it as a sign of very eager bulls. That would have increased the chance of a strong reversal up.
Reversal up from a sell climax is usually minor
The 2 month selloff was exceptionally strong. This combined with the weak buy signal bar make a minor reversal up more likely than a V bottom and start of a bull trend.
A minor reversal means that the rally will either form a bear flag or become a bull leg in what will grow into a trading range. There is only a 30% chance of the rally growing into a bull trend without at least forming a double bottom.
When a sell climax is as extreme as this one has been, the bears are exhausted. The reversal sideways to up often lasts longer and goes higher than what traders might think is reasonable.
Exhausted bears typically are hesitant to immediately sell again once they begin to take profits. Therefore, the weekly chart will probably be sideways to up for at least a few weeks.
Daily S&P500 Emini futures chart:
2nd leg up after extreme sell climax
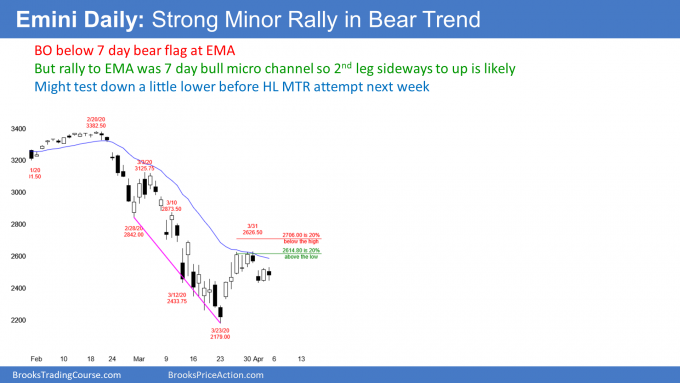
The daily S&P500 Emini futures chart reversed up strongly last week from an extreme sell climax. The rally reversed down from the 20 day EMA, which is a 20 Gap Bar sell signal.
However, that rally was a 7 bar bull micro channel. Every low was above the low of the prior day. That relentless buying usually will have at least a small 2nd leg sideways to up.
Traders were so eager to buy that they were not waiting for a pullback. Instead, they were buying at and above the low of the prior day. The first pullback typically only lasts 1 – 3 days because the bulls are happy to finally get an opportunity to buy below the low of the prior day.
The 1st target is 2706.00, which is 20% down from the high
As long as the Emini is below 2706, it is more than 20% down from the all time high. That means it is in a bear market.
When traders talk about the cash index, they say it is in a bear market if the close is 20% below the highest close. That 20% level is 2708.92.
The bulls want to create signs of strength. That will make other traders willing to buy as the market continues higher.
One sign of strength would be for the market to get back above that 20% correction level. That level is clearly important and therefore a magnet above.
A 50% retracement of the bear trend is at 2781. That is always a magnet.
Another target is the March 3 bull trap
The huge March 13 bull trend bar was followed by an equally strong bear bar that barely overlapped the bull bar. There are therefore trapped bulls at the close of that bull bar. Its close is just below that 2706.00 20% correction level.
Theoretically, the bulls who bought that close bought more lower and have been buying on the way up. They are trying to get back to their 1st buy, which is at that close.
Therefore, when there are trapped bulls, the market usually works its way back to the trap. Many bulls will exit breakeven there on the 1st buy and with a profit on their lower buy.
Sometimes, the bulls are so happy with the rally that they do not exit. Instead, they buy more. If they do, the rally could go much higher. While unlikely, it could continue up to the March 3 high of 3125.75. That was the start of the parabolic wedge sell climax, and that is often a target when there is a reversal up.
What to expect next week
The Emini will likely trade below last week’s low and trigger a weekly sell signal. Since that sell setup is weak, there will probably be buyers below last week’s low.
A reversal up from a higher low within the next couple weeks should reach that 2706.00 magnet above. Sometimes when the market reverses up from an extreme sell climax, it rallies in a bull channel for 100 bars or more. Therefore, a higher low could be the start of a trend up that could last many months. But even if it did, the rally would more likely be a bull leg in a trading range than a resumption of the 12 year bull trend.
What happens if the Emini turns down and breaks below the April low? Traders will expect buyers below. That selloff would create a double bottom with the March low. Traders would then look for at least a couple months of sideways to up trading.
Traders should expect a trading range for at least a few months. The top will probably be around 2700 – 2800 that the bottom will either be the March low or not far below. Since the Emini is currently low in that 2200 – 2800 range, it will likely be sideways to up over the next month or even several months.
Trading Room
Traders can see the end of the day bar-by-bar price action report by signing up for free at BrooksPriceAction.com. I talk about the detailed Emini price action real-time throughout the day in the BrooksPriceAction.com trading room. We offer a 2 day free trial.
Charts use Pacific Standard Time
When I mention time, it is USA Pacific Standard Time (the Emini day session opens at 6:30 am PST, and closes at 1:15 pm PST). You can read background information on the intraday market reports on the Market Update page.

