Monthly S&P500 Emini futures candlestick chart:
Strong bull bar, testing the all-time high
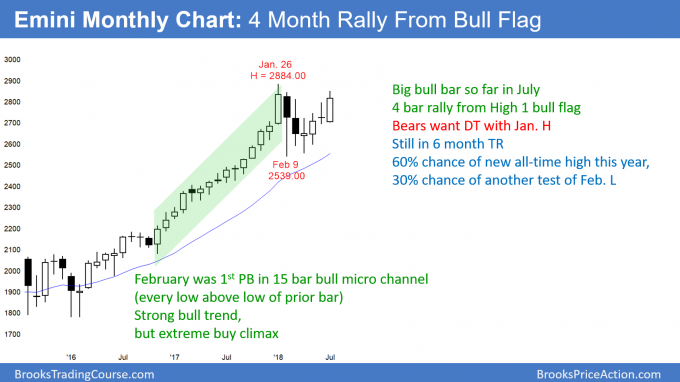
The monthly S&P500 Emini futures candlestick chart has a strong bull bar so far in July. Since there are only 2 trading days left to the month, the bar will probably remain strongly bullish.
The monthly S&P500 Emini futures candlestick chart is in a strong bull trend. January’s buy climax was the most extreme in the 100 year history of the stock market. The 4 month rally is now testing the January all-time high. This was the minimum objective for the bulls.
Since the month has a bull body, it is a weak sell signal bar for the bears who want a double top with the January high. However, if August is a bear bar, that would be a more reliable sell signal.
But, the 2017 rally was so strong that any reversal down will be minor until after at least a 1 – 3 month breakout above the January buy climax high. That is what typically happens after strong buy climaxes. Therefore, the odds are that the Emini will reach 3000 – 3200 later this year.
Weekly S&P500 Emini futures candlestick chart:
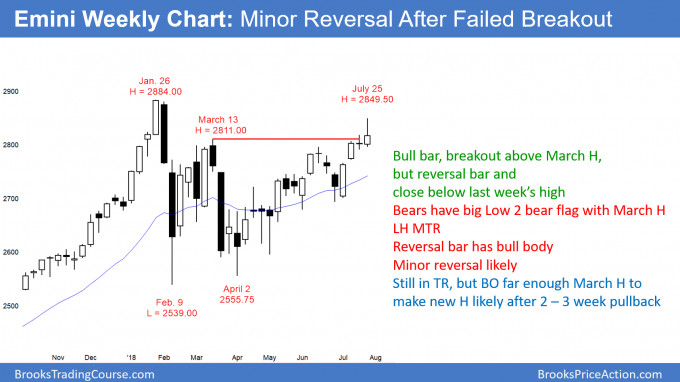
Sell signal bar for failed breakout above 6 month trading range.
The weekly S&P500 Emini futures candlestick chart closed below its midpoint this week after breaking above the 6 month trading range. It is therefore a sell signal bar for next week.
The bears want this week’s reversal to be the end of a 2 legged rally up from the February low. In addition, they see this week as a sell signal bar for a lower high major trend reversal. However, the bull body lowers the probability of a major reversal down.
More likely, the bears will only be able to get a few weeks of selling before the bulls buy again. The break above the March high was far enough above to make higher prices likely, even if there is a 2 – 3 week selloff first.
Daily S&P500 Emini futures candlestick chart:
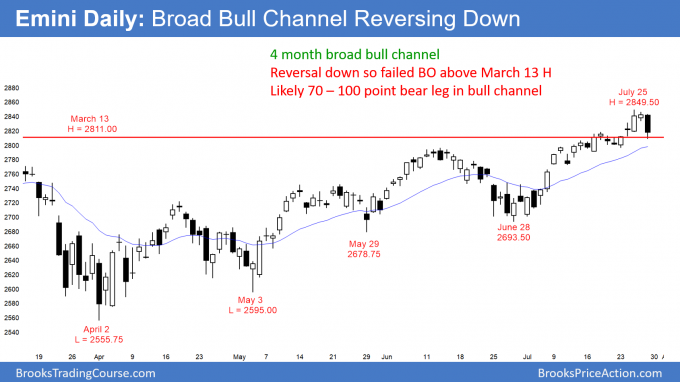
Emini 100 point minor reversal down from buy climax
The daily S&P500 Emini futures candlestick chart reversed down strongly on Friday after Wednesday’s buy climax.
The daily S&P500 Emini futures candlestick chart has been in a bull trend since the May low. But, Friday’s reversal was strong. In addition, it reversed Wednesday’s strong breakout above the 6 month trading range. Finally, the daily chart has been in a tight channel in July, and that is unsustainable. Therefore, the odds are that the Emini will go sideways to down for 2 – 3 weeks.
Targets for the bears are the minor higher lows in the 3 week tight bull channel. The channel began with the July 11 low, which was just above 2770. If the selloff reaches that low, it would be about 80 points. I have been writing all week that the Emini would probably pull back for 50 – 100 points over the next 2 weeks. Friday was the likely start of the pullback.
Can this be the start of a big 2nd leg down, where February was the 1st leg? The bears at this point have a 30% chance. They would need 2 – 3 consecutive big bear bars closing near their lows before traders will believe that the bears were back in control.
Traders can see the end of the day bar-by-bar price action report by signing up for free at BrooksPriceAction.com. I talk about the detailed Emini price action real-time throughout the day in the BrooksPriceAction.com trading room. We offer a 2 day free trial.
When I mention time, it is USA Pacific Standard Time (the Emini day session opens at 6:30 am PST, and closes at 1:15 pm PST). You can read background information on the intraday market reports on the Intraday Market Update page.


