Market Overview: DAX 40 Futures
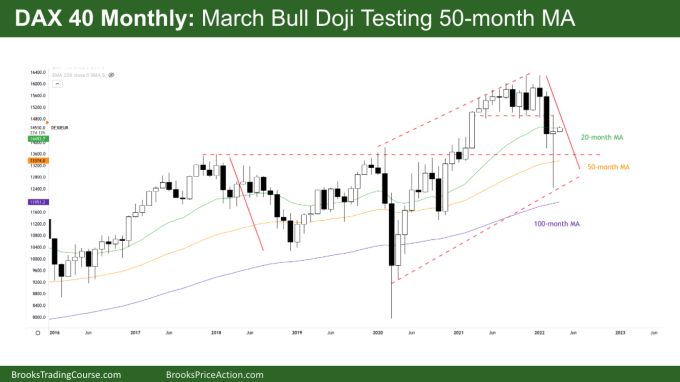
DAX futures had a large sell climax in March but still closed slightly higher. We are sitting at the 50% retracement from the bear leg and are stalling around the 50-month MA. Next week traders will decide if we can get a successful high 1 buy on the monthly chart or the failed high 1 last week will lead to the second leg back down.
DAX 40 Futures
The Monthly DAX chart

- Last month DAX was a small bull doji bar with huge tails above and below, trading slightly above January’s close.
- It is the first 20-month MA gap bar since the Covid lows. It has setup a possible high 1 buy if we go above March.
- Bulls see a tight bull channel converting into a broad bull channel or at worst a trading range, so reasonable place to buy low.
- The bears see 3 pushes up, and a failed breakout above the final flag and will be looking for 2 legs sideways to down, perhaps to the top of the prior range.
- The bulls see a long term trend of buyers around the moving averages and so will expect any move down to be temporary – this remained true last month.
- If there are 2 legs, is this the end of the first leg down or is it still going further?
- The bears want a failed high 1 above and a move lower back to the range lows.
- Looking left we can see most pullbacks have 2 legs and the end of the 2nd leg gets to the 50-week MA. Although it got bought up this month, we can expect sideways to down trading likely to that area as traders decide when the pullback has finished or it is the a bear trend.
- Bulls are looking to confirm a breakout above the 13600 range for a measured move higher. The tight trading range above is a magnet and a reasonable place for bulls to exit.
- However we broke strongly below that price so bears might scale back into shorts around there. The best the bears might get is 2 legs down in a trading range before trend resumption.
The Weekly DAX chart

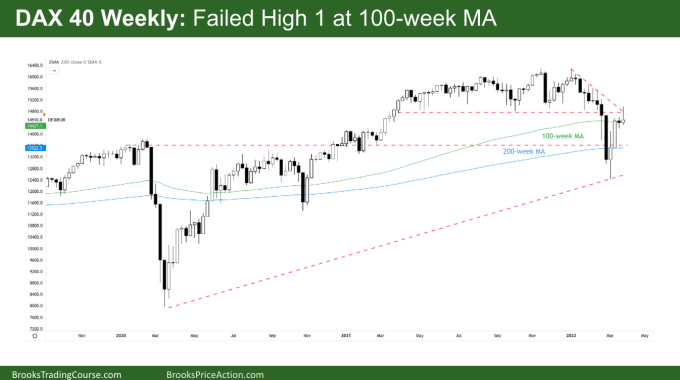
- The Dax weekly was a bull doji and a failed high 1 with a large tail on top.
- Now it is pair of dojis at the 100-week MA — breakout mode. It’s a tight trading range on a lower timeframe.
- The bulls see a strong reversal up from a sell climax. It is the 4th week in a row we traded higher but with large tails on top meaning it is not as bullish as it could be.
- We are at 50% of the prior move so traders are deciding if we are in a broad bull channel, trading range or a tight bear channel. Because all of those traders can be right, there are reasonable buys and sells, so we will likely go sideways.
- Look at the last month — strong bear bars then reversal, strong bull bars, no follow-through so sideways is most likely.
- It broke strongly out of a reasonably tight trading range above, reached a measured move target below and then reversed back to the underside of the range.
- Bulls see a broad bull channel since the COVID lows but know pullbacks often have 2 legs. They won’t buy much higher if they can buy at a better price in a few weeks. So likely buyers below hoping on a higher low, double bottom trend resumption up.
- The bears see a tight bear channel transitioning into a broad channel with last week confirming the downtrend. We pulled back 50% and last week confirmed the underside of the previous range we broke from.
- The bears are looking for a low 1 sell below the last 2 weeks for the 2nd leg back down to the lows. They also see the touch of the 13-week bear channel as confirmation we can go sideways to down. They know the best they can get is probably the February low so they will scalp and exit around the same area
- The bulls would like the low 1 to fail and trade back into the range above for a failed breakout and trend resumption.
Market analysis reports archive
You can access all weekend reports on the Market Analysis page.

