Market Overview: European Market Analysis
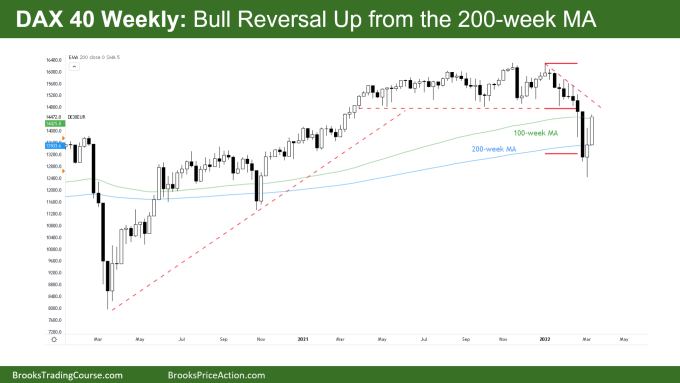
DAX futures bull reversal up from support off the 200-week MA. The bears want it to be a pullback in an 8-week tight bear channel and test of the breakout from the prior trading range. The bulls see a sell climax and high 1 reversal up from a still-intact bull trend off the moving averages. We are currently sitting at the breakout point from the prior range and may go sideways Monday and Tuesday while traders decide.
DAX 40 Futures
The Weekly DAX chart

- This week’s DAX candlestick was a large bull bar with a small tail on top. It’s bullish but not as bullish as it could be and it stopped at the 100-week MA.
- It was a high 1 buy signal from last week and a rejection of the 200 week MA.
- The bears see a pullback from a tight bear channel lasting 8 bars so they expect the first pullback to be minor and are looking for a second leg down to the February lows.
- The bears also see a breakout of a 12-month trading range and now a pullback to test the breakout point at the base of that range.
- The bulls see a deep pullback on a 2-year bull trend up from the COVID lows. They know such a long trend is more likely to become a trading range and a reasonable buy rather than convert to bear trend immediately.
- Bears exited at a measured move target break of that tight trading range and bulls bought.
- Near the top of a trading range is not great math for a buy, so it might be difficult to get bull follow-through here. They might give up and wait for a double bottom lower to buy again.
- Big bars mean big risk which means traders should trade smaller and scale in.
- Big bear bar 2 weeks ago, big bull bar this week. Big up, big down, big confusion. Lots of overlapping bars means we are likely in a trading range and will go sideways.
- The bulls want a follow through bar next week back up to the tight trading range above to keep the trend intact. Though they might need to scale in lower.
- Because it was a strong bull reversal it is not a great sell. Bears might wait for a week to pause before selling a low 1.
- Because we are near the prior breakout point, it is not a great buy either, so likely we go sideways.
- Even a push from the bulls up into that prior trading range could be the start of a broad bear channel and reasonable for bears to sell new highs. The best the bears can do after a 18 month bull trend is probably a bear leg in a trading range.
The Daily DAX chart

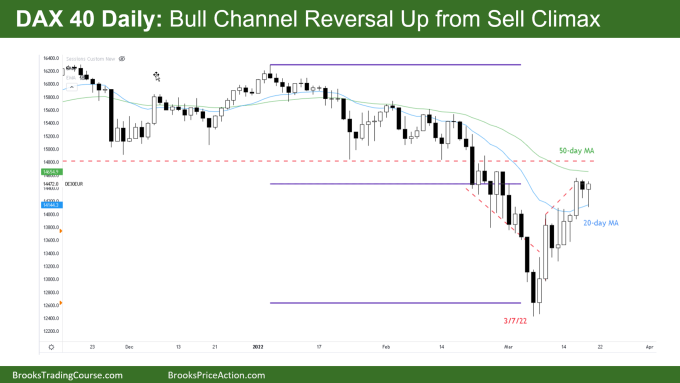
- Friday’s candlestick on the daily DAX chart was a small bullish hammer which failed to trade above Wednesday or Thursday, but got bought up from the 20-day MA.
- It was a failed low L1 at the moving average.
- Bears see it is the 9th bar of a TB2L – ten bars two legs reversal from a tight bear channel.
- It could be the 3rd push up in a wedge setting up a possible low 2 at the moving average and reasonable sell signal.
- Thursday was a gap bar and may also attract sellers who have been happy to sell below the average for over one month now. A chance to sell at a better price.
- It is also the previous breakout point of the prior 6 month trading range and reasonable area to scale in short.
- Bulls see a sell climax, failed break of a wedge reversal up from the Mar 7 low. They can see bulls bought below bars which indicates it is not yet as bearish as it could be.
- Bears are looking for a broad bear channel after the spike with a test of the Mar 7 lows. They have the 50-day MA above which has been resistance for the last month.
- Possibly both are going to be disappointed. Bears are likely to sell above bars and bulls are likely to buy below bars so we might go sideways.
Weekly Reports Archive
You can access all reports on the Market Analysis page.

