Market Overview: Crude Oil Futures
The Crude oil futures bears got a weak follow-through selling on the weekly chart. They hope that this week was simply a pullback and want another leg down breaking below Jan/Feb lows. The bulls want a reversal up from a wedge bull flag and a higher low major trend reversal.
Crude oil futures
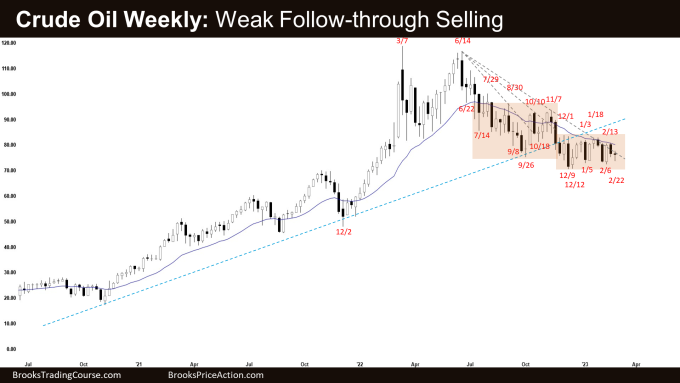
The Weekly crude oil chart

- This week’s candlestick on the weekly Crude Oil chart was a bear doji with a long tail below and a prominent one above.
- Last week, we said that traders will see if the bears can create a follow-through bear bar. If they do, we may get another retest of the trading range low.
- While this week traded below last week’s low, it reversed to close above it. The bears did not get strong follow-through selling.
- The bulls want a failed breakout below the September low and the bull trend line.
- They hope that the last 2 weeks were simply a deep pullback and want a reversal up from a wedge bull flag (Jan 5, Feb 6 and Feb 22) and a higher low major trend reversal.
- They want a retest and breakout above the 14-week trading range high, exponential moving average and bear trend line.
- The bulls need to break far above these resistances with follow-through buying to increase the odds of higher prices.
- The bears got a reversal down from a double top bear flag (Dec 1 and Jan 18) but failed to get follow-through selling.
- They then got another leg down from a wedge pattern (Jan 3, Jan 18 and Feb 13) but did not get strong follow-through selling once again.
- If Crude Oil trades higher, they want the market to stall around the trading range high and the 20-week exponential moving average.
- The last 14 candlesticks are overlapping sideways. That means Crude Oil is in a trading range.
- Poor follow-through and reversals are more likely within a trading range.
- Traders will BLSH (Buy Low, Sell High) until there is a breakout from either direction.
- So far, the bears have tried to push lower 3 times within the trading range but the follow-through selling has been weak.
- If the bears do not start creating strong consecutive bear bars soon, odds will swing to a bull leg testing the 14-week trading range high within a few weeks.
- For now, traders will see if the bears can create another leg down by breaking below January/February lows, or if Crude Oil continues to stall around 72-73 which will likely lead to a stronger upside push.
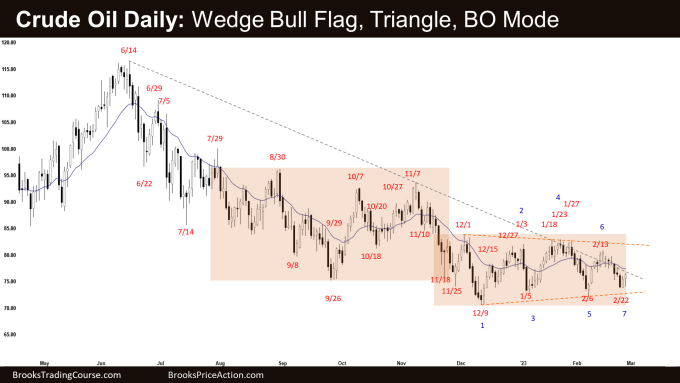
The Daily crude oil chart

- Crude Oil broke below the inside bar on Wednesday but there was no follow-through selling.
- Last week, we said that Crude Oil is in a trading range and poor follow-through and reversals are more likely within a trading range.
- The bears got a reversal lower from a double top bear flag (Jan 3 and Jan 18) but were not able to get follow-through selling below the January low.
- They then got another leg lower from a wedge bear flag (Jan 3, Jan 18, and Feb 13) but did not get follow-through selling this week.
- They want a retest and breakout below the December low forming the larger wedge pattern with the first two legs being September 26 and December 9.
- They need to create strong consecutive bear bars to increase the odds of lower prices.
- If Crude Oil trades higher, they want it to stall around the trading range high and reverse lower again.
- The bulls want a failed breakout below the September – November trading range and the major bull trend line.
- They want a reversal higher from a wedge bottom (July 14, Sept 26 and Dec 9), a wedge bull flag (Jan 5, Feb 6, and Feb 22) and a higher low major trend reversal.
- They want another leg up breaking above the 14-week trading range high.
- For now, Crude Oil is in a 14-week trading range. Traders will BLSH (Buy Low, Sell High) until there is a breakout from either direction.
- Poor follow-through and reversals are more likely within a trading range.
- Markets have inertia and tend to continue to do what they have been doing.
- Crude Oil formed a triangle pattern and is in breakout mode.
- After 3 attempts to push lower with weak follow-through selling, we may see another attempt to test the trading range high soon.
- For now, traders will see if the bears can create follow-through selling below January/February lows or if Crude oil will stall around 72-73 and attempt an upside breakout within a few weeks.
Market analysis reports archive
You can access all weekend reports on the Market Analysis page.

