Market Overview: Crude Oil Futures
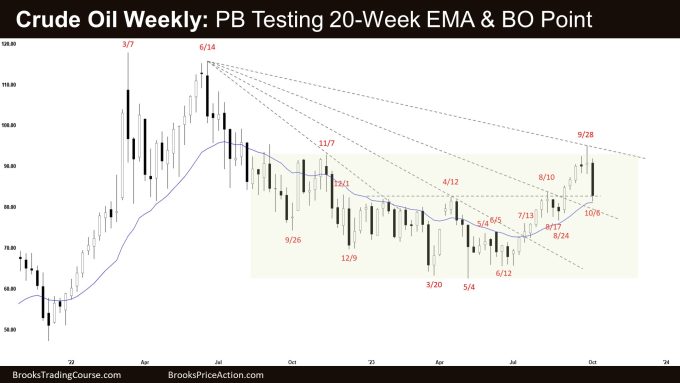
The weekly chart formed a Crude Oil strong pullback testing the breakout point (April high; trading range high) and the 20-week EMA. The bulls want the 20-week EMA to act as a support and a reversal up from a higher low. The bears want a reversal down from a large double-top bear flag with the November 2022 high and a parabolic wedge (Jul 13, Aug 10, and Sept 28).
Crude oil futures
The Weekly crude oil chart

- This week’s candlestick on the weekly Crude Oil chart was a big bear bar closing in the lower half of the candlestick.
- Previously, we said that while the odds slightly favor the market to still be in the sideways to up phase, the move up since June has lasted a long time and is slightly climactic. A minor pullback can begin at any moment.
- The pullback has begun this week.
- The bears want a reversal down from a large double-top bear flag with the November 2022 high and a parabolic wedge (Jul 13, Aug 10, and Sept 28).
- They hope that the strong move up is simply a buy vacuum and a bull leg within a larger trading range.
- They want a strong bear leg to retest the trading range low (May low) to begin.
- This week, they got a big bear bar testing the 20-week EMA.
- Next week, they will need to create follow-through selling, closing below the 20-week EMA to increase the odds of a deeper pullback.
- Previously, the bulls have had a tight bull channel since June. That means strong bulls.
- They see the pullback this week simply as a test of the breakout point (trading range high; April high).
- They want the 20-week EMA to act as a support and a reversal up from a higher low, completing the larger wedge pattern with the first two legs being August 10 and September 28.
- At the very least, they expect at least a small sideways to up leg to retest the leg extreme high (Sept 28).
- They hope to get a measured move based on the height of the 41-week trading range, which will take them to around $103.
- Since this week’s candlestick was a big bear bar closing in the lower half, it is a sell bar for next week.
- For now, odds slightly favor the market to still be in the sideways to down pullback phase.
- Traders will see if the bears can create follow-through selling, closing below the 20-week EMA. Or will the market trade slightly lower, but stall around the 20-week EMA area?
- The bear trend lines becoming progressively less steep also indicates a loss of momentum for the bears.
- The market likely has flipped into Always In Long.
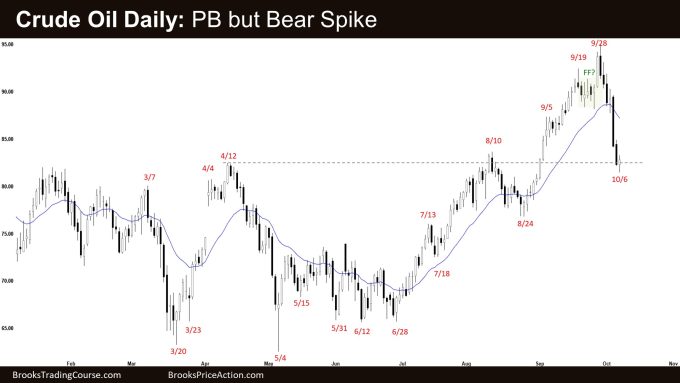
The Daily crude oil chart

- The market traded lower for the week, closing far below the 20-day EMA.
- Previously, we said that while the market continues to slightly favor sideways to up, the recent move up is slightly climactic and has lasted a long time. A minor pullback can begin at any moment.
- The pullback phase has begun and tested the April high which was the breakout point of the recent rally.
- The bears want a reversal down from a large wedge pattern (Jul 13, Aug 10, and Sept 28, a smaller wedge (Sept 5, Sept 19, and Sept 28) and a final flag.
- The move down is strong in the form of a bear spike (strong bear bars with little overlap).
- That increases the odds of at least a small second leg sideways to down after a small pullback.
- The bears hope to get a spike and channel down and for the market to have flipped into Always In Short.
- The bulls got a strong rally from June in the form of a tight bull channel which lasted a long time.
- They hope that the strong pullback this week is simply a sell vacuum test of the breakout point (April high).
- They want the pullback to stall around the April high and form a higher low followed by another strong leg up, completing the larger wedge pattern with the first two legs being August 10 and September 28.
- For now, odds slightly favor the market to still be in the sideways to down pullback phase, and for a second leg lower after a pullback.
- The pullback should last at least TBTL (Ten Bars, Two Legs).
- If the bears continue to create consecutive bear bars closing near their lows, it will increase the odds of the bear leg testing the May low to begin.
Market analysis reports archive
You can access all weekend reports on the Market Analysis page.

