Market Overview: Crude Oil Futures
The Crude Oil futures moved lower last week, but it was a failed Bear BO (breakout). Price rebounded strongly and finished with consecutive bull bars by Friday on the daily chart and a bad bear close on the weekly. After breaking a trend line, the bulls are setting up a lower low double bottom (LL DB) and a major trend reversal. The bears want it to fail and get another lower high for a break below. Currently, we are sitting on the 2022 breakout point as traders decide in which range the price will go.
Crude oil futures
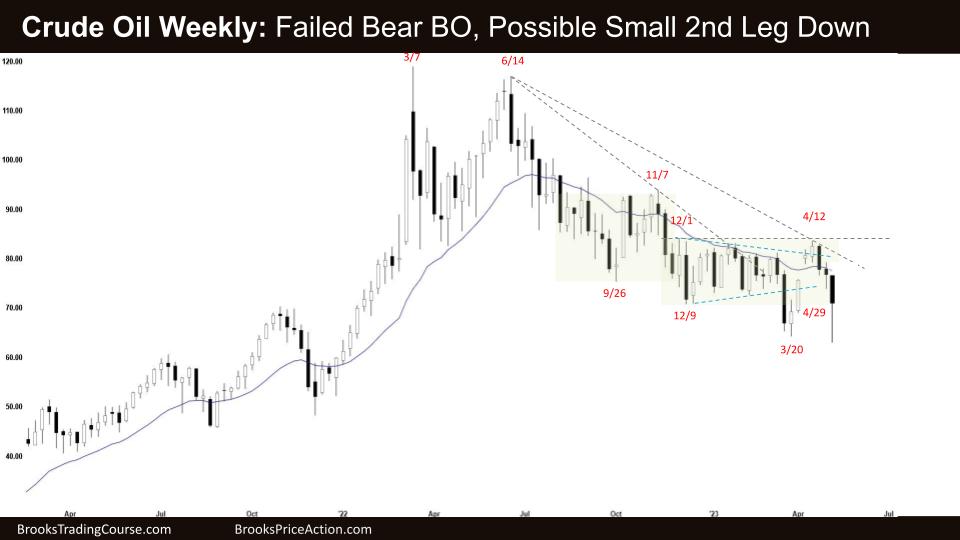
The Weekly crude oil chart

- This week’s candlestick on the weekly Crude Oil chart was a big bear bar closing above its midpoint. It was a failed bear BO below the low of the prior bull leg.
- Some computers will see it as a bull bar so that it can act as a High 1 buy signal. But most traders should wait for something clearer if we trade above.
- The bears broke below the March 20th low but failed to get a good close. It is three consecutive bear bars, so they might expect a small second leg sideways to down—even if it is just one more bar.
- We said last week that a possible major trend reversal was setting up, and it was a low-probability sell, low in a tight trading range. That was true.
- The bulls didn’t get their second leg so they were disappointed. But now with a failed Bear BO they might look to buy more strongly.
- Disappointment is a good sign you are in a trading range.
- The bears who got trapped on March 20th got out – those who sold below the big bear bar and those who sold above the bull doji. Lucky for them!
- Bulls got two closes above the moving average, but some were disappointed and exited when there was weak follow-through buying. The break above the minor trend line meant likely support below the low, and there was.
- It was a bad stop order sell at a 50% pullback and below the 4 bull bars in a tight trading range, so it was a good limit order buy there – those traders are already in the money.
- It is a big bear doji, so it is a bad buy signal, and because of the high close, it is a bad sell signal – so next week has a high chance of being an inside bar.
- Now with a new low, there are probably sellers above April 12th.
- In a tight trading range, traders should expect strong bars to fail immediately, so next week is more likely a bull bar.
- Bulls rely on the structure from October 2022 – the prior breakout high, so we are testing that support level. Bears closed the gaps, which is less bullish.
- The bulls want it to be a giant bull flag but look at the size compared to the trend. Flat to declining moving average and a lack of strong consecutive bull bars make it hard for bulls to set up a strong move.
- Expect sideways to up next week.
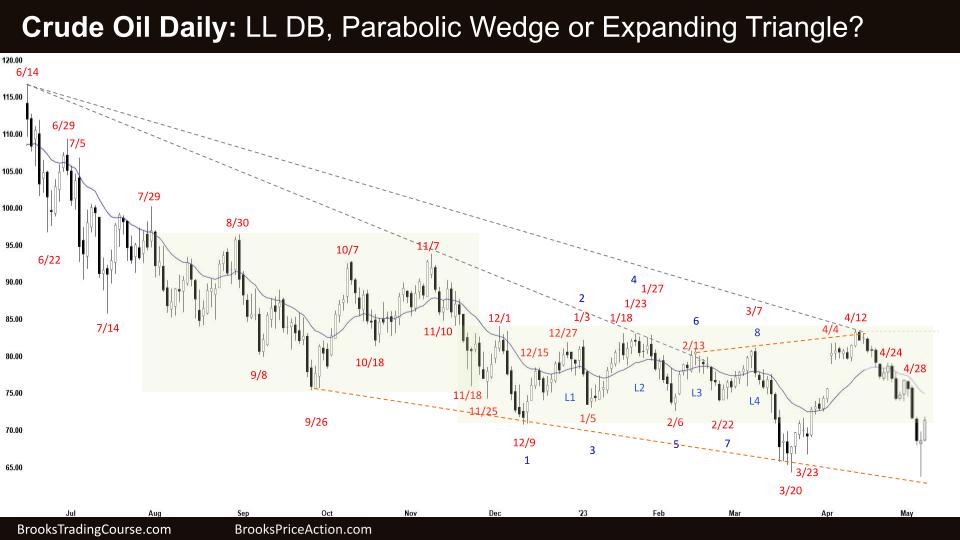
The Daily crude oil chart

- This Friday’s candlestick on the daily Crude Oil chart was a big bull bar closing on its high. We might gap up on Monday.
- The weekly time frame looks like it is setting up a major trend reversal, which looks clearer on the daily chart.
- The bulls see their lower low double bottom and have a strong signal from Friday. Some bears will wait to sell higher below the breakout point above or closer to the MA.
- The bears got a parabolic wedge (Apr 20, Apr 26, May 3) after the bulls failed to buy the MA pullback above. The target for the test would be the Apr 28th high.
- The bears might even get a small 4th leg. Most traders should avoid selling legs 4 and 5 as they have a higher chance of reversing.
- Because the bull leg failed, trapped bulls might be up there looking to get out.
- Any trapped bears from March had a second chance to get out now, so the bulls should get two legs sideways to up.
- Some might count Apr 24th as the failure and start the count over, so we are on a high 2 buy above the doji on Thursday.
- Bears want one more bar down after the three strong bear bars, but it is unlikely to get very far. Why? It looks more like a leg in a trading range than a clear bear spike.
- It looks like the bear channel is changing into an expanding triangle – but tight trading ranges play tricks on the eyes and trap traders trying to get breakouts.
- It generally rewards traders with fading breakouts and strong moves near the extremes.
- For example – the failed High 1 started this bear move down. The bears might get the opposite, a Low 2, which fails and reverses back up after this failed bear BO.
- Most traders should be long or flat. Trading ranges often give a second entry signal, a higher probability trade.
- Expect sideways to up next week.
Market analysis reports archive
You can access all weekend reports on the Market Analysis page.

